
If there is one absolute rule it’s that with each passing generation things get increasingly complicated for PC hobbyists in general, and PC gamers in particular. There is a dizzying array of truly advanced technologies in play these days so it is understandable that there is a fair bit of confusion. One area that I’ve found is especially challenging for folks is display technology. Back when the world was 2D and our monitors were powered by cathodes and electron guns life was easy. Today with twisting liquid crystals and real time rendering of actual simulated depth, not so much. For this entry I plan to cover a few of the biggest “gotchas” in terms of understanding todays display landscape. First is how an LCD actually works, second will be how you measure the performance of an LCD and last will be what is really happening with 3D. There are lots of deep scholarly articles on these topics, but they leave too much room for misinterpretation and confusion because they tend to focus on the science and not netting out the general concept. For this entry I will be doing the exact opposite. With a solid foundation in the general concepts it should then be a lot easier to dive into that deeper material and build expertise. So without further ado…
The Liquid Crystal Display
It’s right there in the name actually, but what does it really mean? If you consider the mission of a monitor, it is to present an image to the viewer that has been generated electronically by the computer. So what is an image? An image is nothing more than patterns of light hitting our eye and being interpreted by our brain. As a result, any display must start with a light source and as such, this is a good place to start when describing an LCD. Originally LCD’s didn’t have their own light at all. They relied on reflected light from outside the monitor in order for you to be able to see anything. Of course this isn’t a fantastic solution for indoor application so engineers eventually found a way to build a light source into the monitor. The first backlit LCD’s were lit with a fairly standard light bulb. As technology progressed brighter, longer lasting, and lower power light sources were sought which lead to the innovation of modern Light Emitting Diode, or LED, backlit LCD’s. In an LED LCD a strip of long lasting and low power, yet evenly bright, light emitting diodes provide the light source.
OK, so we have an evenly lit up surface, but how does that translate to an image of a bunny with a pancake on its head or a Star Trek meme? There are two ingredients missing. The first is obviously color and the second is a way to actually create images. The first one is fairly easy (at least conceptually). If you take a flashlight, and take 3 pieces of translucent plastic, one red, one blue and one green, you can do a little experiment that will get you 80% of the way in understanding the basic principals of how an LCD works. Consider the following:
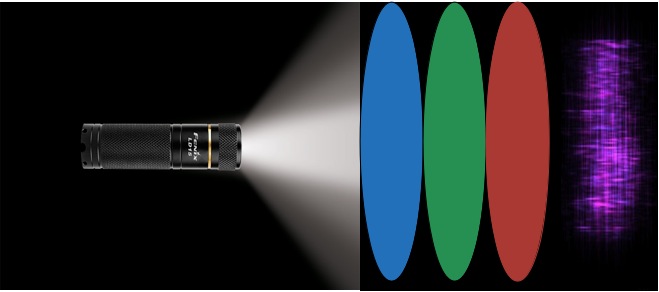
If you shine a nice white light through a red filter, as if by magic, red colored light comes out the other side. Same for green, or blue, or any color. If you take those filters and start to combine them in different patterns (for example red and green, but not blue or red and blue, but not green) you can produce a broad spectrum of color. At it’s essence, this is how an LCD works as well. Red, green and blue filter layers are applied to the light source to produce color. This of course begs the question of how those filters are applied selectively and that leads directly to the question of how images are made using a light source and a set of filters.
Up top we touched on the notion that the workings of an LCD were laid out right in it’s name, but so far we haven’t discussed anything about either liquid or crystals. As it turns out, the liquid crystal piece is where the magic really lies. In working through the challenge of how to selectively filter a light source, engineers eventually hit on something really ingenious. As it turns out, there exists in nature certain combinations of elements which exist in a kind of semi-liquid state. That is, they appear to be a liquid, but when exposed to certain outside stimulus, like heat, light or electricity, they don’t react like a liquid. As it turns out, the molecules which make up these liquids behave in a way similar to crystals. To make it really simple, and tie it back to LCD monitors, when this type of material is exposed to electricity, it actually moves away from it. That part is important. Consider this rendering courtesy of Fokus Technologies:
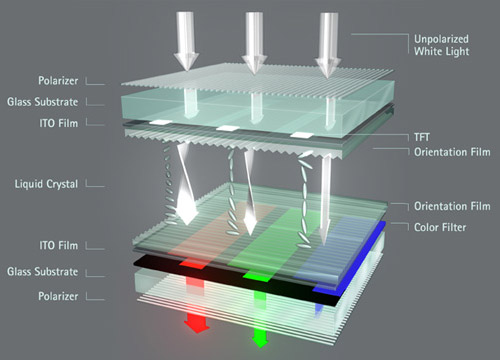
Here you can see the light coming in from the top and eventually reaching some colorful filters that are on the bottom. But what’s going on there in the middle? That is the liquid crystal. And as you can see, it’s all “twisty”. If you think of it like a shutter, or a switch, what happens is that when there is no electricity it’s closed and light is blocked. When there is electricity it is open and light can pass through. This is all well and good and hopefully fairly easy, but the question remains, where does the electricity come from? The answer for that is lots and lots of transistors. If you don’t know what a transistor is, once again the easiest explanation is to think of it as a switch or a gate. If the transistor is “on”, it is holding an electrical charge and if it is “off” it is not. Combined with the liquid crystals you can imagine that if the transistor is on, light can pass through, and if it is off, light cannot. And that gives us the complete picture; quite literally (pun intended). If you imagine the light source, the filters, the layer of liquid crystals, and a whole bunch of transistors (one per pixel typically) all working together to produce a digital mosaic of colored dots, then you’ve got the hang of it.
Measuring LCD Performance
Producing a single image isn’t particularly useful in isolation, so a monitor has to be able to produce lots of images, frequently with a fair number of differences between them, in rapid sequence, and do it continually. To express this process we talk in terms of “frames per second” which is simply the number of distinct images displayed every single second. For video (a movie, TV show, etc), generally 30 frames in a second is required to trick the brain into seeing motion instead of lots of static images. For games, where you are actually interacting with the scene and the brain is more hyper focused, in order to trick the brain into thinking it’s actually moving, 30 frames per second is just getting started. Most fast moving games required 60 frames per second for convincing motion. So what all of this tells us is that to be useful a monitor has to be pretty fast in displaying images. Consider the math:
1s / 60fps = .016s = 16ms
Each second, 60 frames are displayed. That means each frame has .016 seconds of life before the next frame comes. That’s 16 milliseconds before the frame changes. Every 16 milliseconds, the display has to be able to update the image in order to deliver 60 frames per second. How do we know if a monitor is capable of doing this? With all of those transistors and the moving liquid crystals it seems like a lot of work has to happen in not much time at all. In order to really measure how long a monitor really takes to produce that image, we have to start at the very beginning; the 3D pipeline. Time for another rendering this time courtesy of Laurent Gomila:
See all of that stuff that’s happening in “Geometry” and “Rendering”? That is all happening on the GPU. Above that is the game engine and staging work that the CPU does. Below it where it says “frame buffer” is the point where the image is fully constructed, is a bitmap, and is on its way out to the monitor to get displayed. Let’s assume that the CPU and GPU have no problem producing 60 frames per second in our example. The first place we have to measure for potential delay is in that space between the image leaving the frame buffer and traveling down the HDMI, DVI or display port cable into the monitors circuitry and when the monitor actually begins to activate the transistors it needs to in order to display that image. This span of time is known as input lag and it is one of the ways we measure a monitors performance. What contributes to this lag is any number of factors that basically boil down to how efficient and well designed the monitors basic signaling and display circuitry is. Input lag is measured in milliseconds and anything below 30 is generally pretty good. Of course the closer to 0 the better because at this point all we are doing is introducing potential bottlenecks that will prevent our powerful 3D pipeline workers (that CPU and GPU combo easily capable of 60fps) from getting their “product to market” (the images they’re rendering at 60fps out to your brain).
Once the display has started rendering the image, the next performance measurement is just how long it takes it to finish. This boils down, once again, to the specifics of the circuitry. We kept things fairly simple in the LCD overview, but here it makes sense to go a bit deeper. All LCD monitors, at their core, work with transistors providing the electrical current needed to cause liquid crystals to move. Implementations, however, vary greatly and have a huge impact on both image quality, and how quickly the monitor is able to produce those images. The most common LCD types are TN or “twist nematic”, IPS or “In-Plane Switching” and various forms of VA or “vertical alignment”. The differences between these technologies is the way the crystals twist away from the electrical current. Once again in the spirit of simplicity, the thing to remember is that in “TN” designs, the focus is on speed. So the crystals are aligned to twist away as quickly as possible at the expense of image quality and viewing angles. At the other end of the spectrum, in IPS designs the crystals are aligned to twist away in a direction that provides a higher quality image, viewable at a much greater angle, but at the expense of taking more time. Vertical alignment, in it’s various flavors, attempts to split the difference ending up with images that are not quite as good as IPS, produced not quite as quickly as a TN.
With this in mind, the actual performance metric for how quickly a monitor can display the image is response time. Like input lag, it is measured in milliseconds. Unfortunately, when you see a manufacturers quotes response time in ms, they are discussing average response time. The worst case response time, which would be the time required to change the state of literally every single pixel from the color black to the color white, is much higher. We call this a “full black to white transition” and it is often measured in independent testing by folks like Anand and Tom. Decent IPS displays have a full refresh response time that is sub 30ms and that usually maps to a manufacturer advertised “average response time” of 12ms or so. That number represents changing the pixels from a grey color to another grey color.
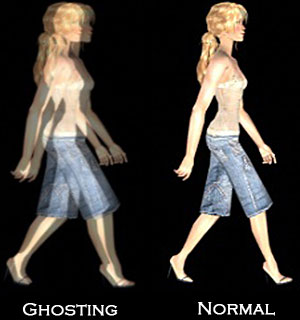
The last performance measurement of a monitor is the elephant in the room at this point; that being the actual refresh rate! The refresh rate is the theoretical maximum performance of the monitor in terms of how many times in a second the screen can be re-drawn. It is measured in “Hz” or cycles per second. With LCD panels, there was a standard refresh rate of 60Hz for quite some time and recently 120Hz and higher rates have become increasingly common. The thing to keep in mind here is that this is a physical measurement of how many times in a second the monitor is refreshing the image. Whether or not a new image made the cut is dependent on the input lag and response time. In other words, just because a monitor is “60Hz”, or “120Hz” does not mean that it will always be able to display “60fps” or “120fps”. When we took a look at the math above we found that 60fps leaves only 16ms to actually render that frame. A combination of decent input lag and a decent response time for a full black to white transition is normally as high as 60ms. That’s a lot. At that rate 4 frames would be lost. Of course very rarely is the screen fully transitioned from black to white. This is the sleight of hand that allows that “average response rate” figure the manufacturers promote to be reasonable. So what happens if the monitor delays are lagging behind the refresh? That’s where you start to see what is called “ghosting” or the eye picking up on the fact that the frame rate is lagging the refresh rate. A “double image” type of phenomenon. One more rendering courtesy this time of Jagat Review:
Before we jump into 3D, what is the net of this? If I had to give advice it would be to know your goals really well. If you are doing professional design work, or color reproduction really matters, or you even just like to see a really well rendered desktop, stick with the top notch IPS panels. Preferably one with good color rendition. The thing to look for there is a “10 bit panel”. Brief side bar, what that means is that the display can render 1 billion colors (10 bits means a 10 bit color value for the red, the green and the blue or 30 bits total. 30 bits in a binary value means a maximum value of 1 billion). Here too manufacturers use some tricks, so if color accuracy really matters, look for a “true 10 bit panel”. Typical IPS panels are “8 bit” which means they can display 16.7 million colors. Some TN panels are actually 6 bit which is only 256,000 colors and starts to look pretty poor. Those panels once again use some tricks to attempt to simulate 16.7 million colors the same way some of the 8 bit panels use tricks to simulate 1 billion colors.
If what you are chasing is ultimate performance, however, none of that matters much. This generally translates to really serious gamers. For really serious games, the way to go is the lowest input lag and response time you can get, coupled with the highest possible refresh rate. This means that with current technologies as of this writing you will certainly be looking at a TN panel and you won’t be getting anything above 1080P (1920x1080P).
So What About 3D Then?
In order to understand how 3D displays work on a computer, it is necessary to do a quick review of the basic concept of 3D imaging in general. The brain, each and every day, takes input from the left eye and the right eye and stitches that input together to create depth. Traditional displays are showing you moving images, but these images are “flat” because the left and right eye are perceiving the same image. As long as they are shuffled quickly enough, we see motion, but we do not see depth.
So how does 3D work? There are two technologies that are relevant here, “active” and “passive” 3D, but both work on the same principal. The idea is that the display is going to give the left eye and the right eye two different images so that the brain is tricked into thinking it is seeing real depth where in fact there is none.
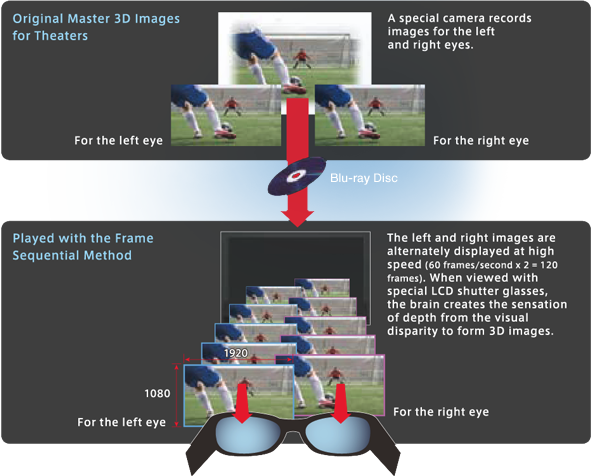
In “active” 3D, the system must render the image twice, once for the left eye, and once for the right eye, in full detail. These two images are then transmitted by a device called an emitter to a pair of 3D glasses that are “active”. Meaning the glasses actually have a small computer onboard that listens for the transmitted image and then take the left image and shows it to the left lens and the right image and shows it to the right lens in very quick succession, blacking out the eye that is not currently supposed to be seeing anything. This happens very fast. 120Hz is the requirement for active 3D which means 8ms is the time for each eye yielding a real frame rate of 60fps. What this means is that the end result is convincing and smooth. It can, however, lead to motion sickness or even headaches over time. This is simply a side effect for some people of the process being used. Here is a rendering of active 3D at work courtesy of Gosu Gadget:
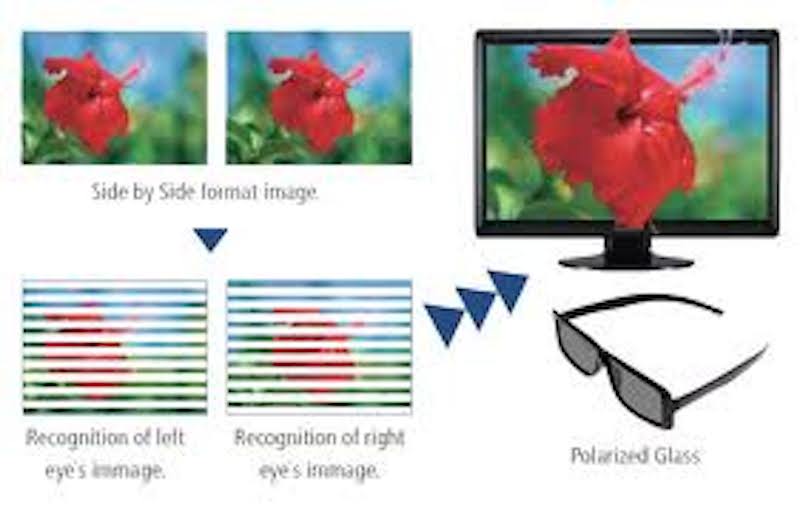
Passive 3D is slightly different. Once again, the scene must be rendered twice, once for each eye. This time, however, the two images are cut in half vertically, and a left eye image and a right eye image are produced that are color offset from each other. This image is then displayed at the refresh rate of the display (60Hz). The viewer wears a set of “polarized lenses”, or glasses with colored filters on them which separate the “left half” and “right half” that is interleaved together based on color offsets. The brain is then tricked, once again, into perceiving depth once it stitches the image back together. Passive 3D tends to be less convincing than active, and certainly lower resolution, but also brighter and a bit “easier on the brain” for more people. Which of these technologies one chooses, or whether one chooses one at all really, is highly subjective and the type of thing that absolutely requires trying it in person before buying! Before signing off here is a quick rendering of passive 3D courtesy of Viso Pix:
That concludes this entry on a pretty complex topic. Hopefully this will help a bit!
