
Introduction
Last entry we pit two cloud giants against each other, the 800lb incumbent AWS and the scrappy newcomer vCHS, and the results were surprising. I promised that the series would continue and so when I woke up this morning to an invite for MSDN subscribers to enjoy tons of free Azure credits, I knew what I had to do! This entry we will apply the same methodology introduced in part I to Azure and see how things turn out. Before getting started though, there are a few subjective things worth mentioning. At the end of the day, despite this being a performance focused series, a cloud service is really about a lot more than performance. In fact SLA, ease of access, breadth of services, cost and overall experience almost always should be ranked higher when evaluating a platform. With that in mind, Microsoft has a few things going for it that are worth calling it:
- Commercial Model: this one is really powerful. I don’t want to accuse a former employer of “dumping” per say, but let’s just leave at Microsoft being Microsoft. What does that mean? It means that there are a lot of ways to get fairly significant Azure usage for free. MSDN entitlements are really good, there is an AWS style “free tier” and there are plenty of credits to be found inside of other products and agreements (like EAP). I think Microsoft really wins here in terms of making the platform commercially accessible. The AWS free tier was an amazing model, but Azure goes one step farther. In addition there are lots of ways to pay once you grow beyond the free options; from credit card based on demand billing all the way through adding the service to an existing Enterprise Agreement there is a lot of flexibility here.
- Onboarding Experience: first impressions matter right? Having launched into Azure from the welcome email from MSDN support, I can say that the Microsoft onboarding experience is excellent. Time to cloud, was instant since it was just a matter of adding an entitlement to my existing Microsoft account, and after entitlement there was a very nice, and very quick, 5 step 30 second tour of the basic console UI showing you where things are and how to get started. Again, Microsoft trumps AWS here. I think this is possibly a cultural thing. Amazon has an extremely developer centric culture. The APIs are comprehensive and well documented and provide everything a developer would need to do anything. Being great at UX, their console UI is also quite nice, but it is functional. It can, at times, even be a bit overwhelming. After sign-up you are dumped directly into a fairly imposing set of services controls. Azure, by contrast, is a product of Microsofts long history of simplifying (or “dumbing down” for the haters), infrastructure management. Say what you will about the folks at Redmond, but no one can deny that they are excellent at GUI and wizard driven configuration of complex services. That knowledge has been applied to Azure and is immediately apparent. The console is more intuitive and that initial tour is a nice toe in the water. I think traditional infrastructure folks (not devops), and particularly Microsoft infrastructure folks, will be more comfortable here.
- Service Maturity: it’s sometimes easy to forget how long Microsoft has been at this with all of the noise around AWS, but logging into Azure you see it immediately. There is just a lot here. A mature catalogue and a wide breadth of services. Integration with the Microsoft suite has also benefitted from years of iteration and, at this stage, it’s actually quite good. Similar to Windows Phone, but much better, Microsoft has polished and polished this offering and now has quite a good shine on it. In terms of the breadth and depth of the catalogue, Azure is the only real competitor to AWS at this stage. The other platforms will get there, but a “feature comparison” matrix at this stage is primarily a two dog fight.
As with the extremely important support aspect we touched on last entry, these are just a few more of the many less obvious value areas of a cloud platform to keep in mind when doing a subjective evaluation. These entries are all about the objective, though, so with no further ado, let’s get to the testing!
Test Setup and Overview
The methodology is of course staying consistent here, but there are again some changes in the specific machine configuration since achieving true parity in this are is very difficult across platforms. Only vCHS allows you to tailor machine sizes:
- OS: Windows 2008 R2 – I wanted to use Windows for the testing since it is relevant to such a large number of enterprise customers
- Benchmark Suite:
- PCMark 8 v2 – PCMark ended up a bust crashing on both VMs (detail below)
- CrystalDiskMark 3.0.3
- SiSoft Sandra Lite 2014 R2 20.28
- DaCapo 9.12 Java Suite
- System Info: CPU-Z – to take a deeper look at what the platform is providing for compute, I settled on my old favorite CPU-Z
- Virtual Hardware: last entry we saw that AWS imposed “t-shirt sizes” when it comes to machine configuration whereas vCHS gives you buckets of resources. Azure goes the “t-shirt sizes” route as well:
- CPU: 1 “shared core”, “A0 level”. What the heck does this mean? Who knows! We’ll find out in a bit…
- RAM: the “A0 level” VM, which is the closest match to our t1.micro baseline, provides 768MB RAM. There is no way to get smaller, so Azure will have a small advantage here.
- Storage: with this level of Azure VM on auto-pilot, the service created a whole bunch of block accessible storage somewhere. This will also make sense in a bit.
- Network: single standard 1Gb/s (in theory) virtual NIC for the instance and for the VM
Machine Creation
And here we find a bittersweet mixed bag. On the one hand I love the presentation here. The UI/UX is truly excellent. On the other hand, the time to VM was very long. Not sure what was going on, but it was a bit odd. It might be that the “A0 level” VM gets deprioritized in provisioning, but even if so, the AWS t1.micro is also a bottom of the line commodity instance and was provisioned much more quickly. We’ll take the bad medicine first; here are the results of the “time to VM”:
Time to VM/Instance Results:
- Azure Time to VM: 9:45*
No, that is not a typo. The Azure VM took nearly 10 minutes to come online. Now on the one hand, how spoiled are we that having a fully functional Windows server spring into existence attached to a high performance network and ready to work in 10 minutes has become bad? But oh the other hand, both AWS and vCHS got this same task done in a third of the time. I asterisked this number because the provisioning process takes place in phases (illustrated below) and 9:45 was the time at which we got the “complete” message. At 7:45 the VM was up, but the status was “installing extensions” so, in my opinion, this should not be counted as truly “ready”. The good news is that the process itself was wonderful:
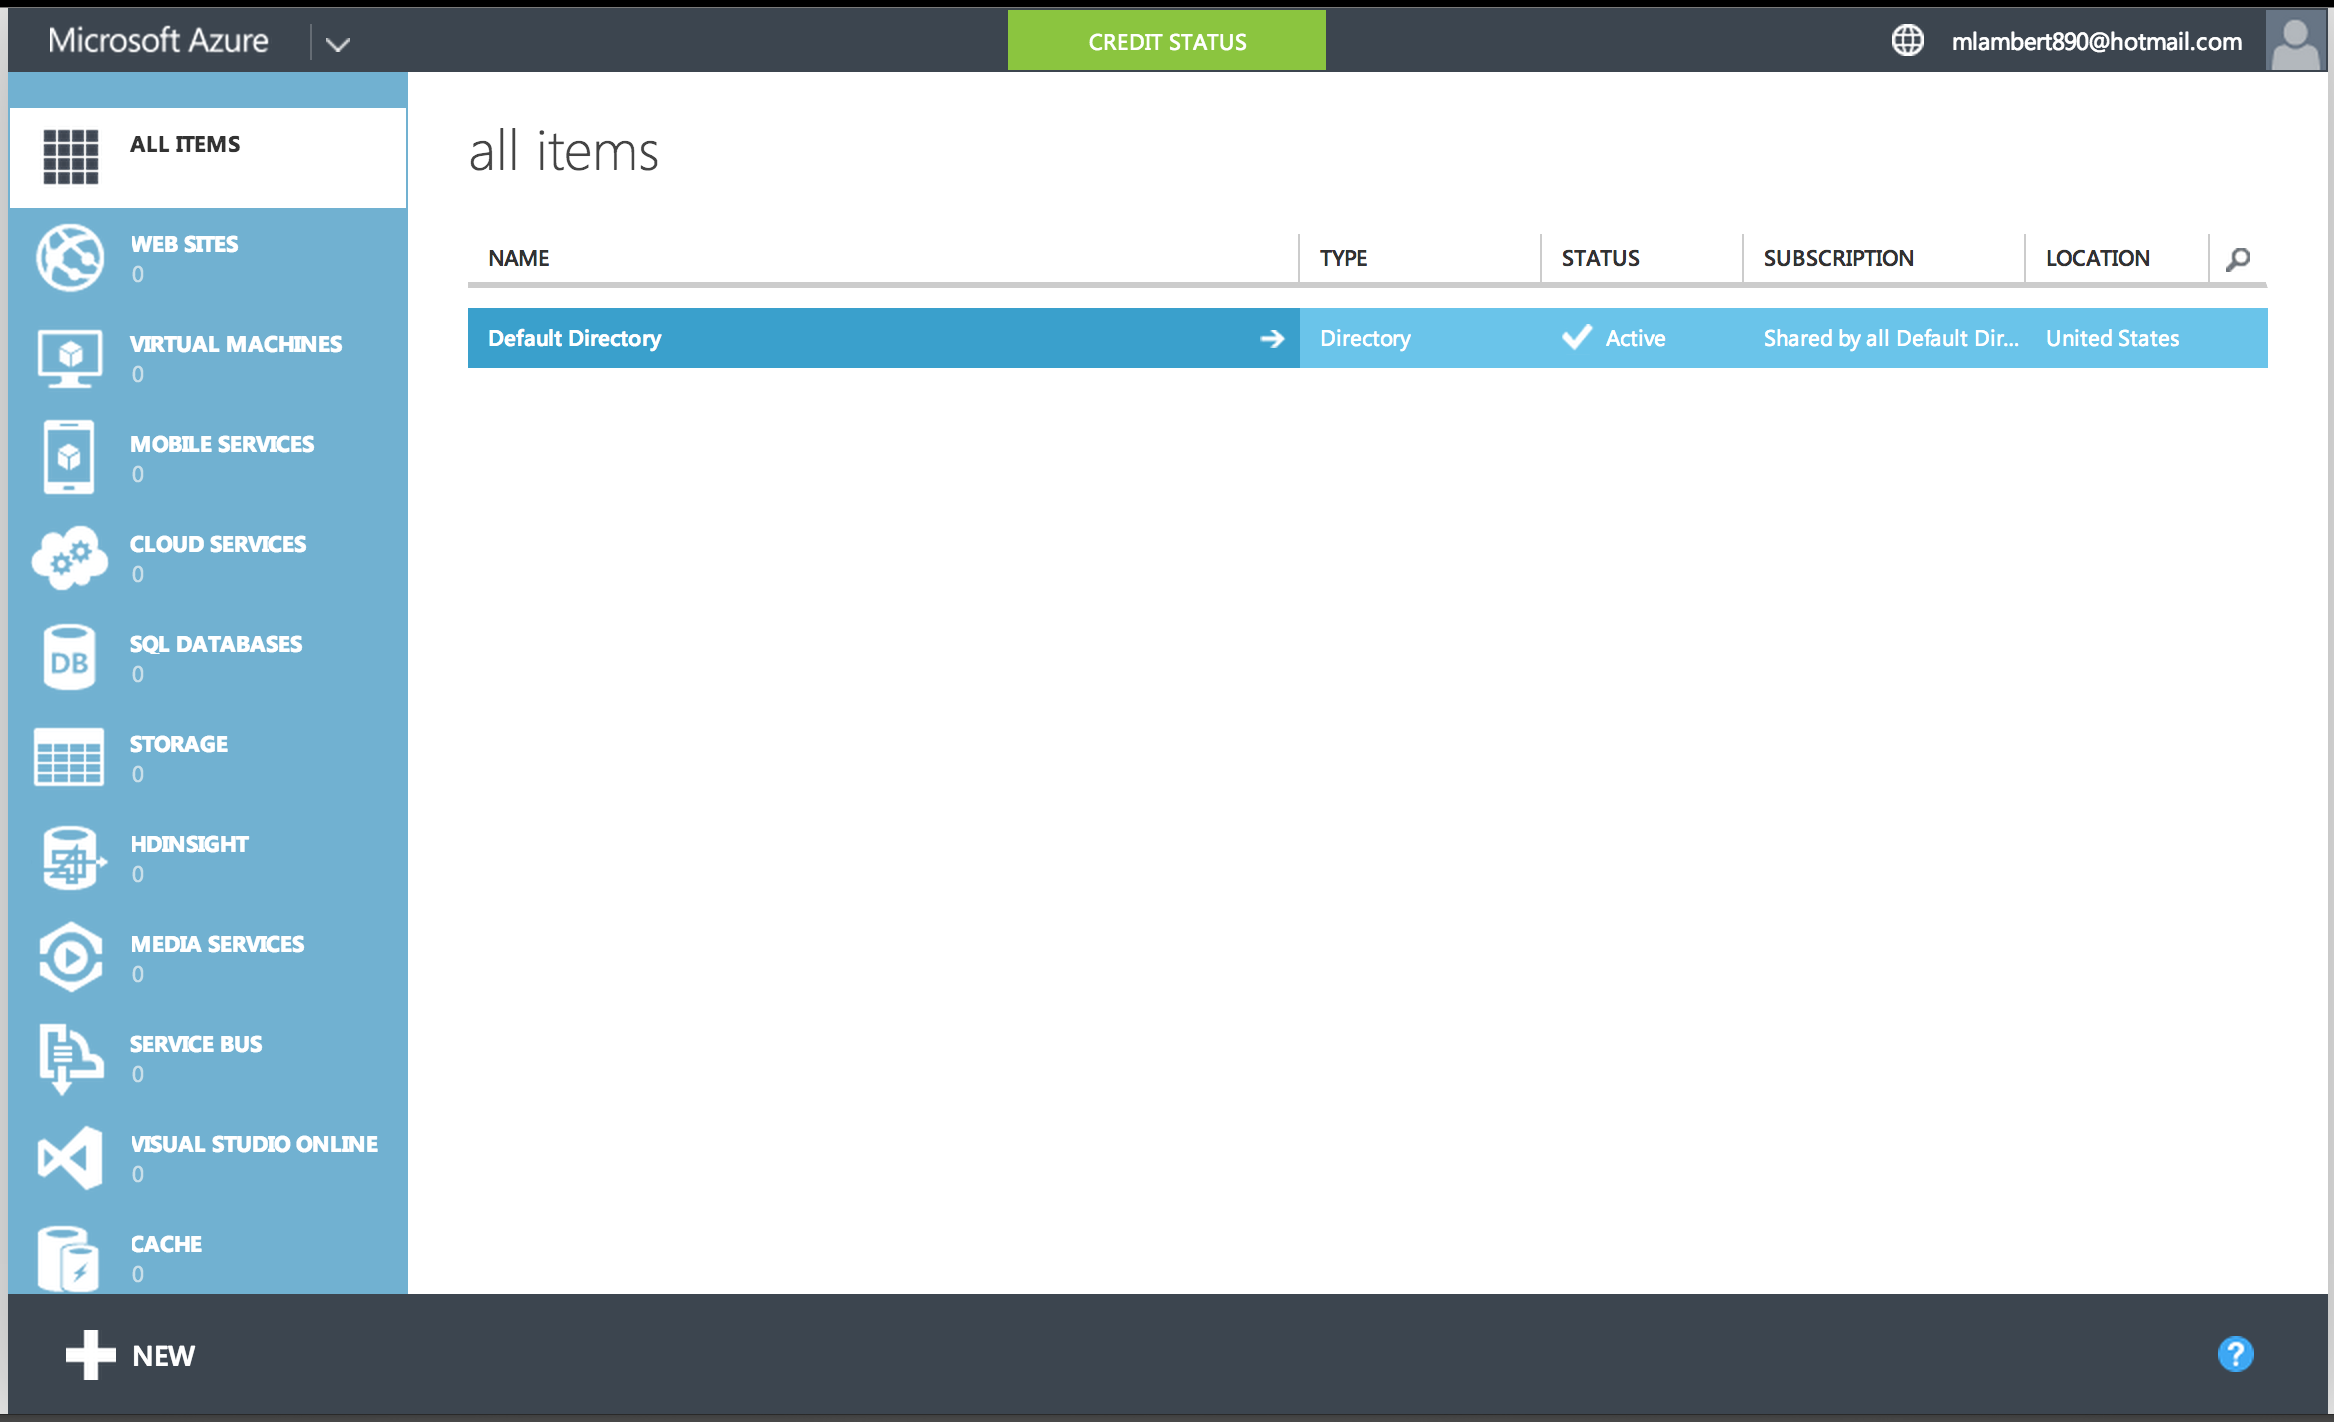
Screen 1: First up is the basic console view. Services are grouped nicely by category on the left with a context sensitive action bar across the bottom of the display and a context sensitive workspace dominating most of the real estate to display objects and status. Here we see a blank slate since this is my first trip into Azure. Notable is the presence of Visual Studio in the services menu. Good product integration here and extremely compelling for Microsoft developers.
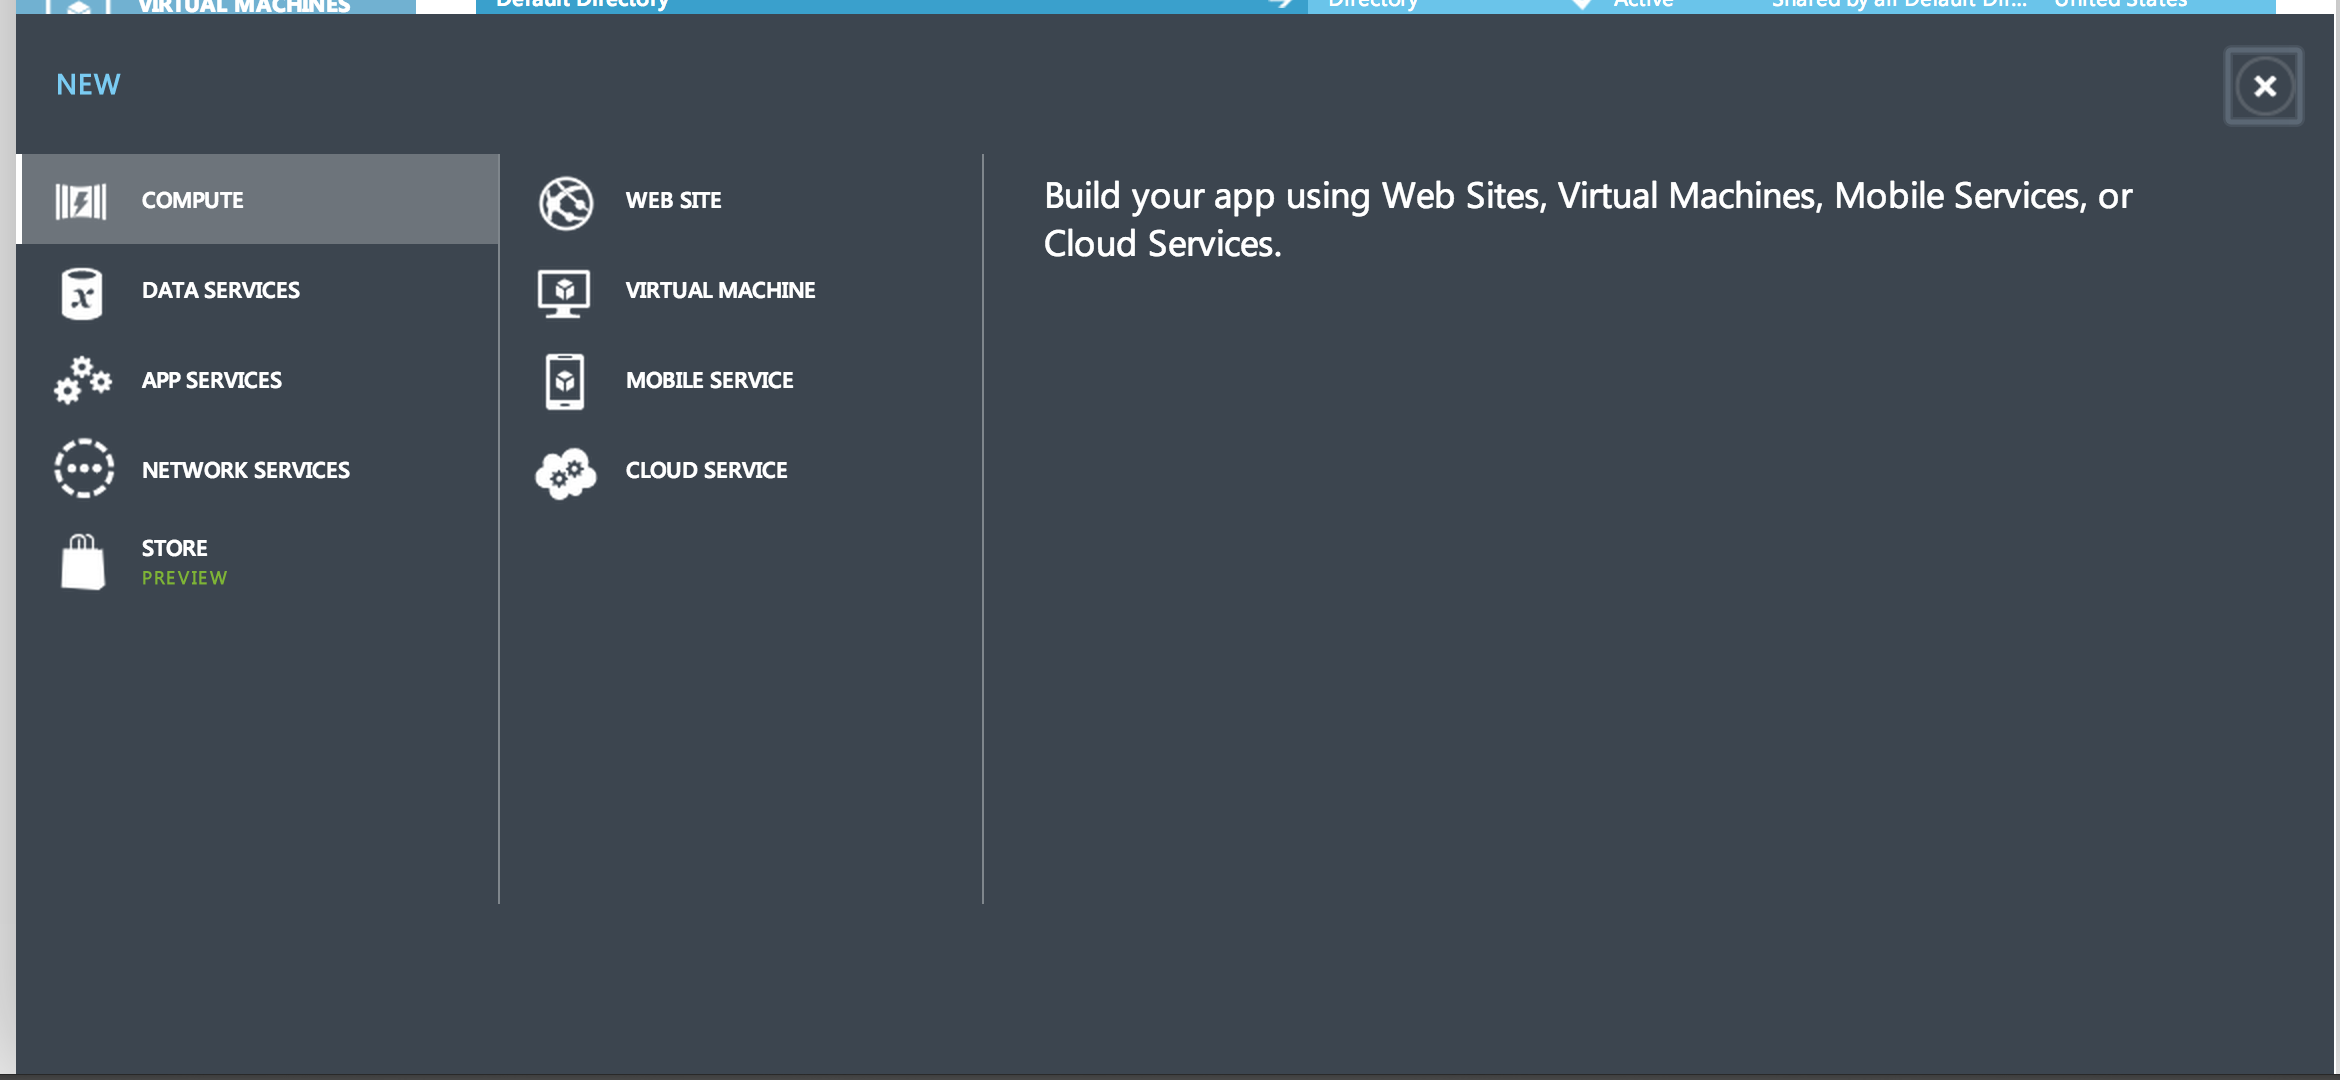
Screen 2: Selecting “New” from the action bar with the focus on “All Items” brings up the global “Create New Object” menu hierarchy. Azure has adopted the Metro theme, but it works pretty well here I think. The options here are interesting, ranging from “Virtual Machine” to “Cloud Service” and demonstrates Microsoft taking both a bottom up (the newest member of the family represented by Azure IaaS VMs) as well as top down (service centric) approach. Contrasting this is interesting. AWS currently takes a similar “mash up ” view to cloud consumption, with numerous orchestration services providing automated provisioning of services. OpsWorks gives you Chef based configuration management which can deploy N-Tier apps via wizard, whereas Elastic Beanstalk gives you PaaS-esque app containers on demand (pour in code and go). In addition you have the likes of Cloud Formation providing a low level, comprehensive, infrastructure descriptor language. It’s a bit disjointed, though, and not always clear to the novice when a given approach is preferable. Microsoft is going out on a limb here with this service centric view that attempts to be much more prescriptive and say “hey, do you want to build a website? or a mobile app? or launch a cloud service? or how about just a VM?” How this plays out in actual implementation is out of scope here, but definitely worth another entry.
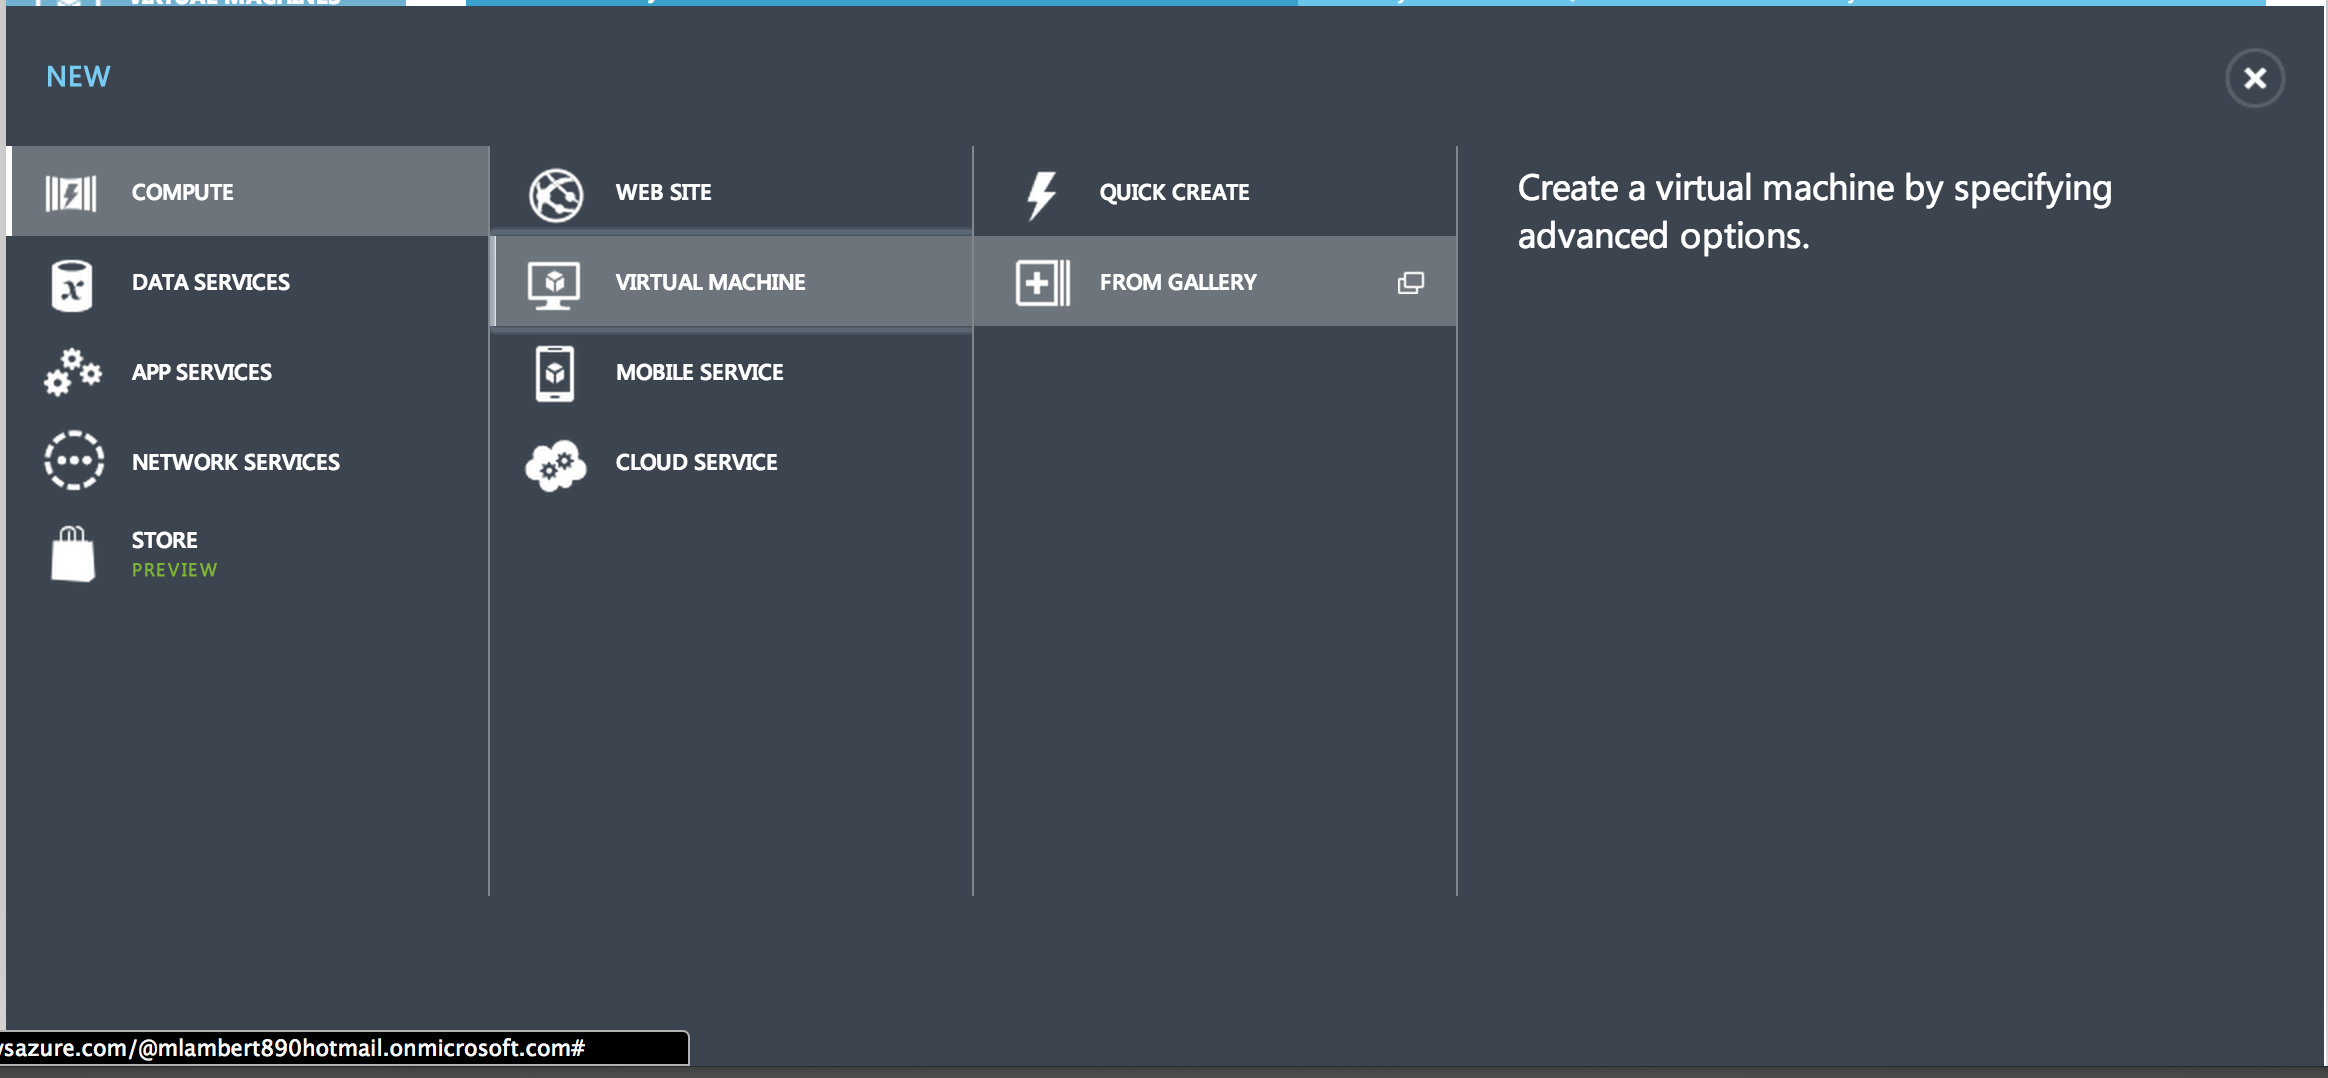
Screen 3: Selecting “Virtual Machine” we are given the option of either “Quick Create” or “From the Gallery”. “Quick Create” is the bespoke option where you create a base machine, “From the Gallery” brings us to the Azure catalogue. We’re going with “From the Gallery” this round.
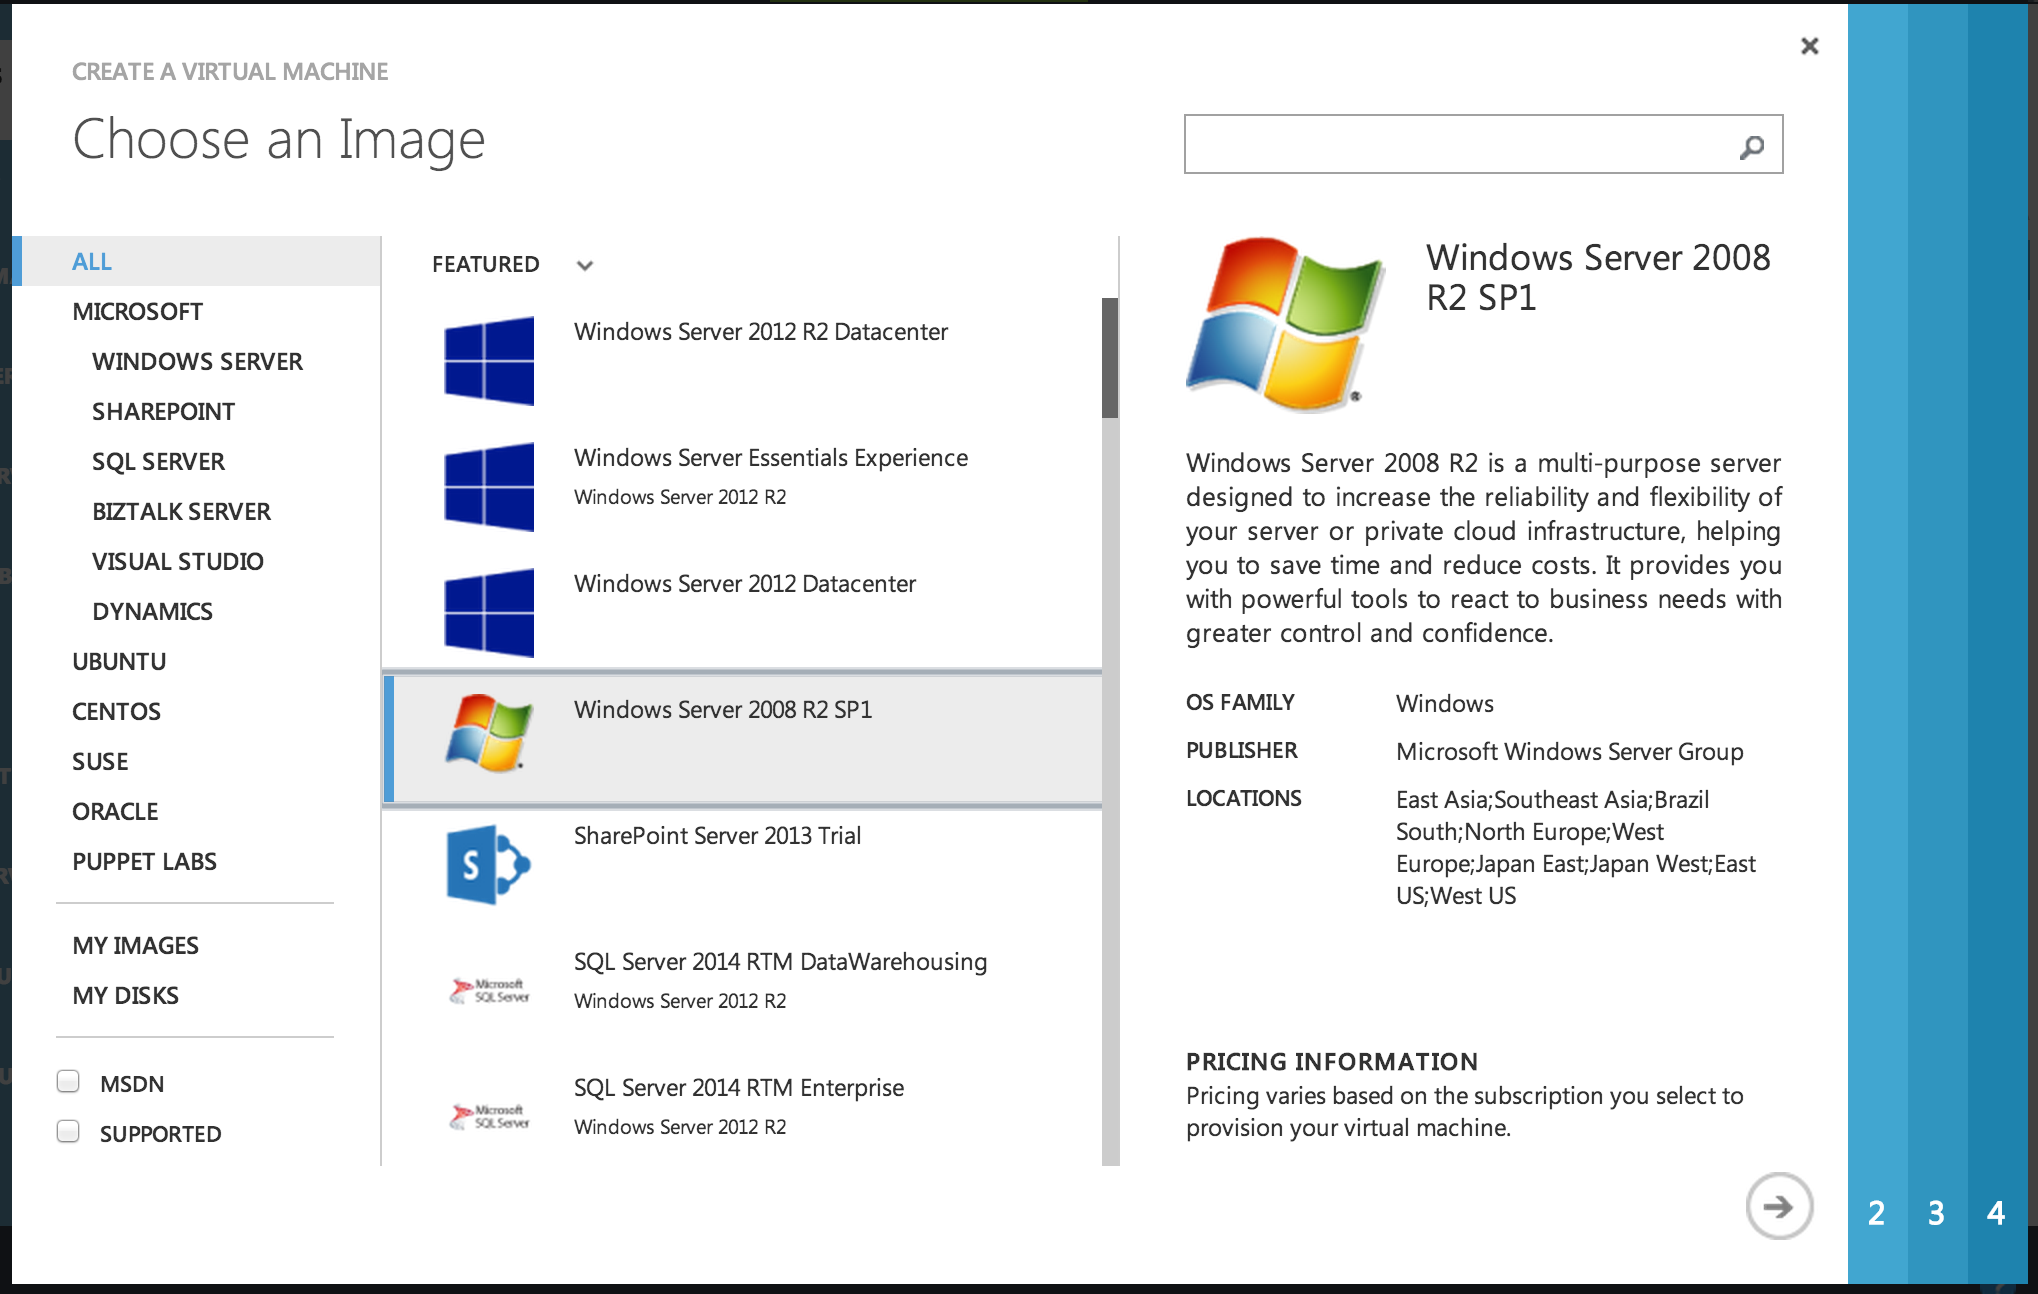
Screen 1: The Gallery is nicely populated and includes lots of Microsoft product suite, as well as several flavors of Linux. Oracle and Puppet are nice surprises here. Notable is that N-1 as about as deep as the catalogue gets in terms of Microsoft product availability. Not exactly “evergreen”, but close. Of course you can always upload your own images. Not exactly a cakewalk, but doable as Sandrino Di Mattia demonstrates in this great entry. For our purposes we need Windows Server 2008 R2, so we are good to go.
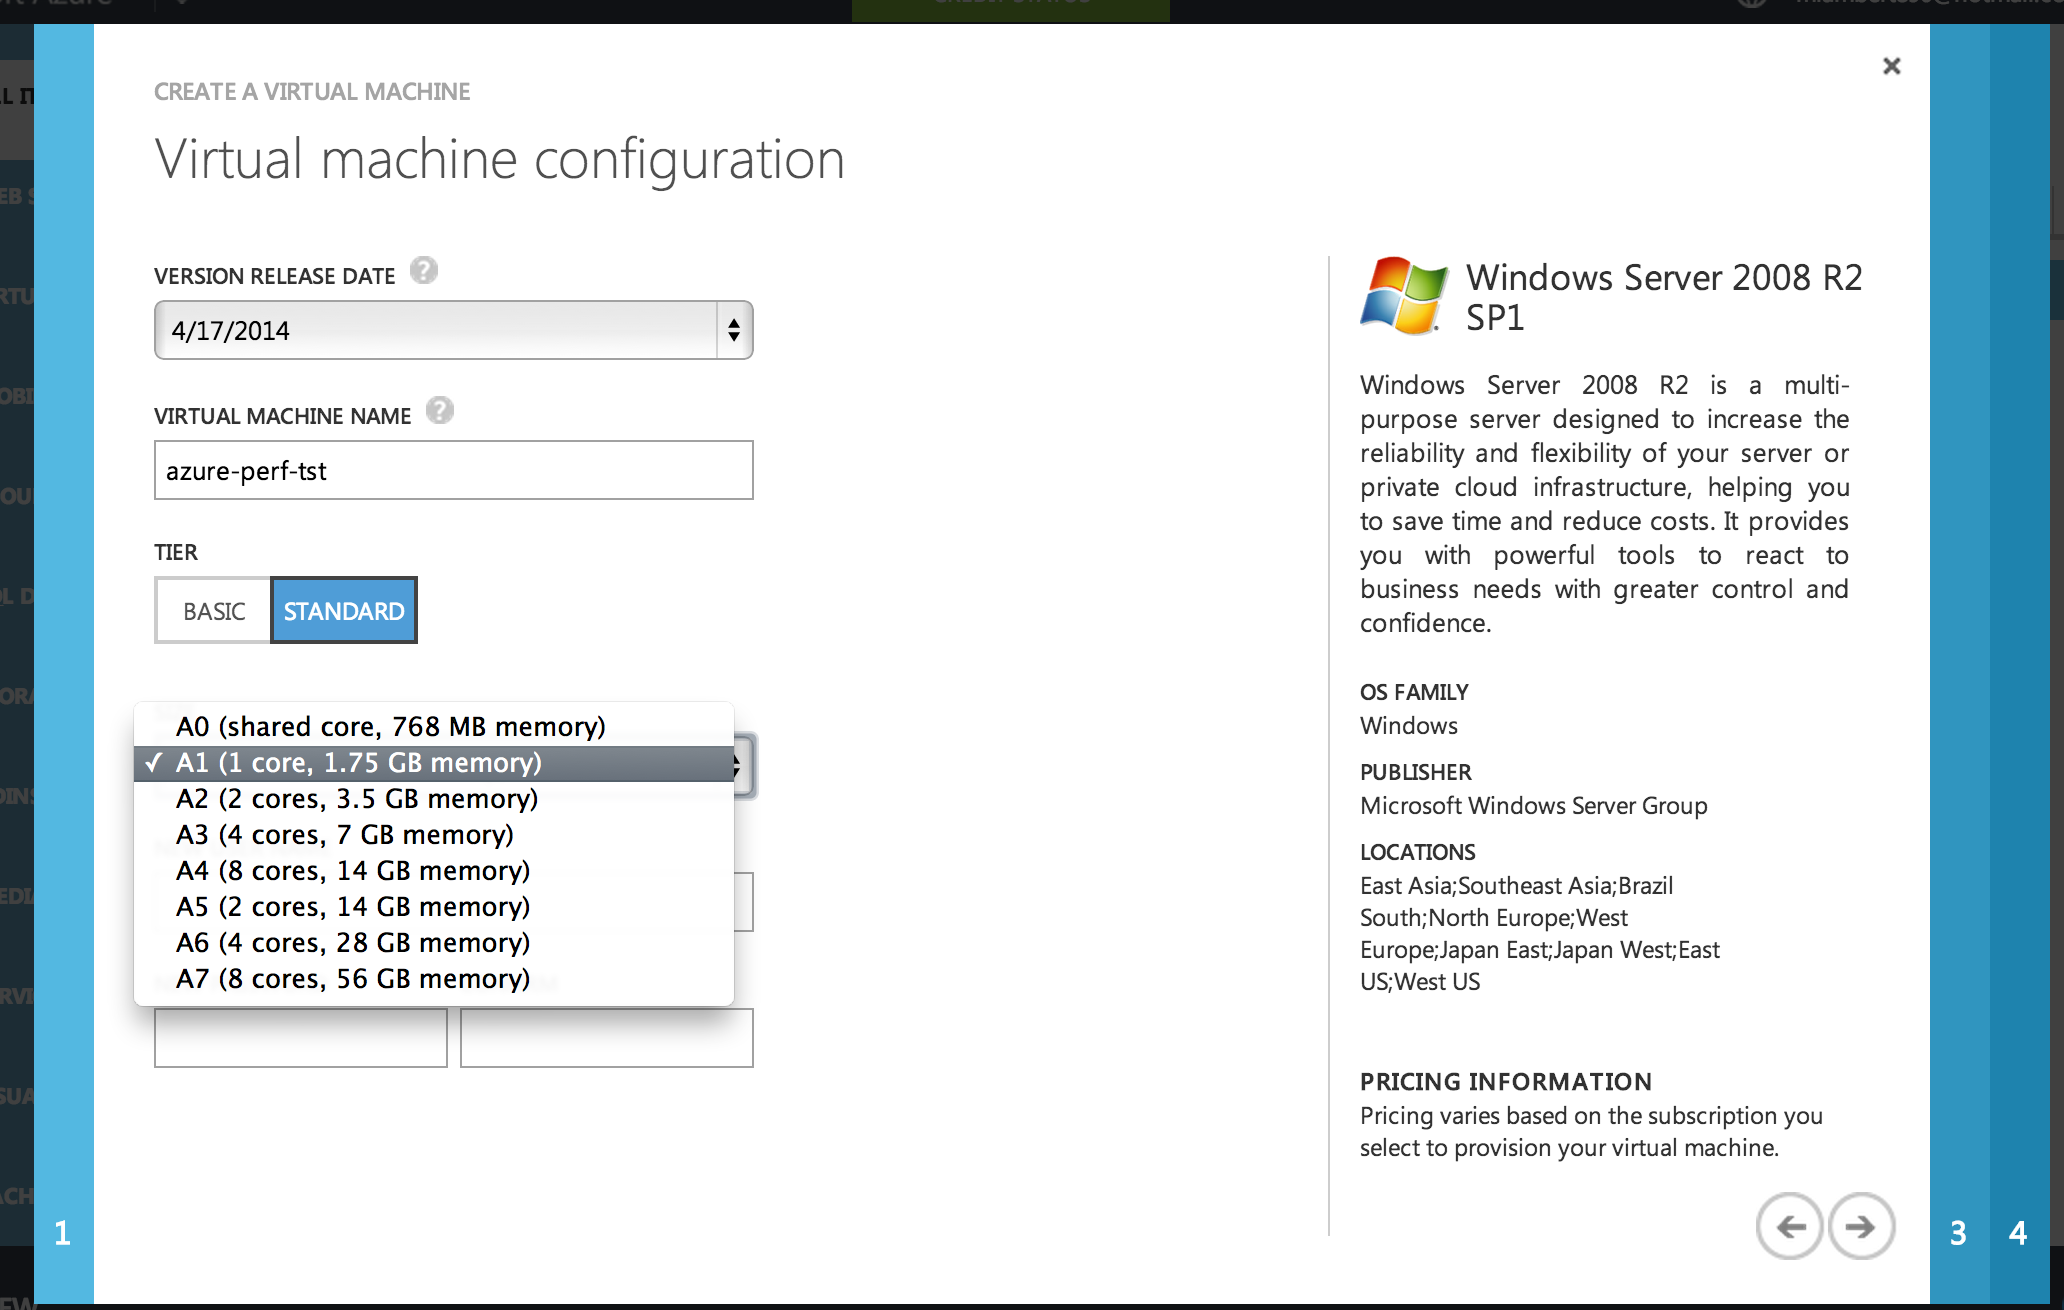
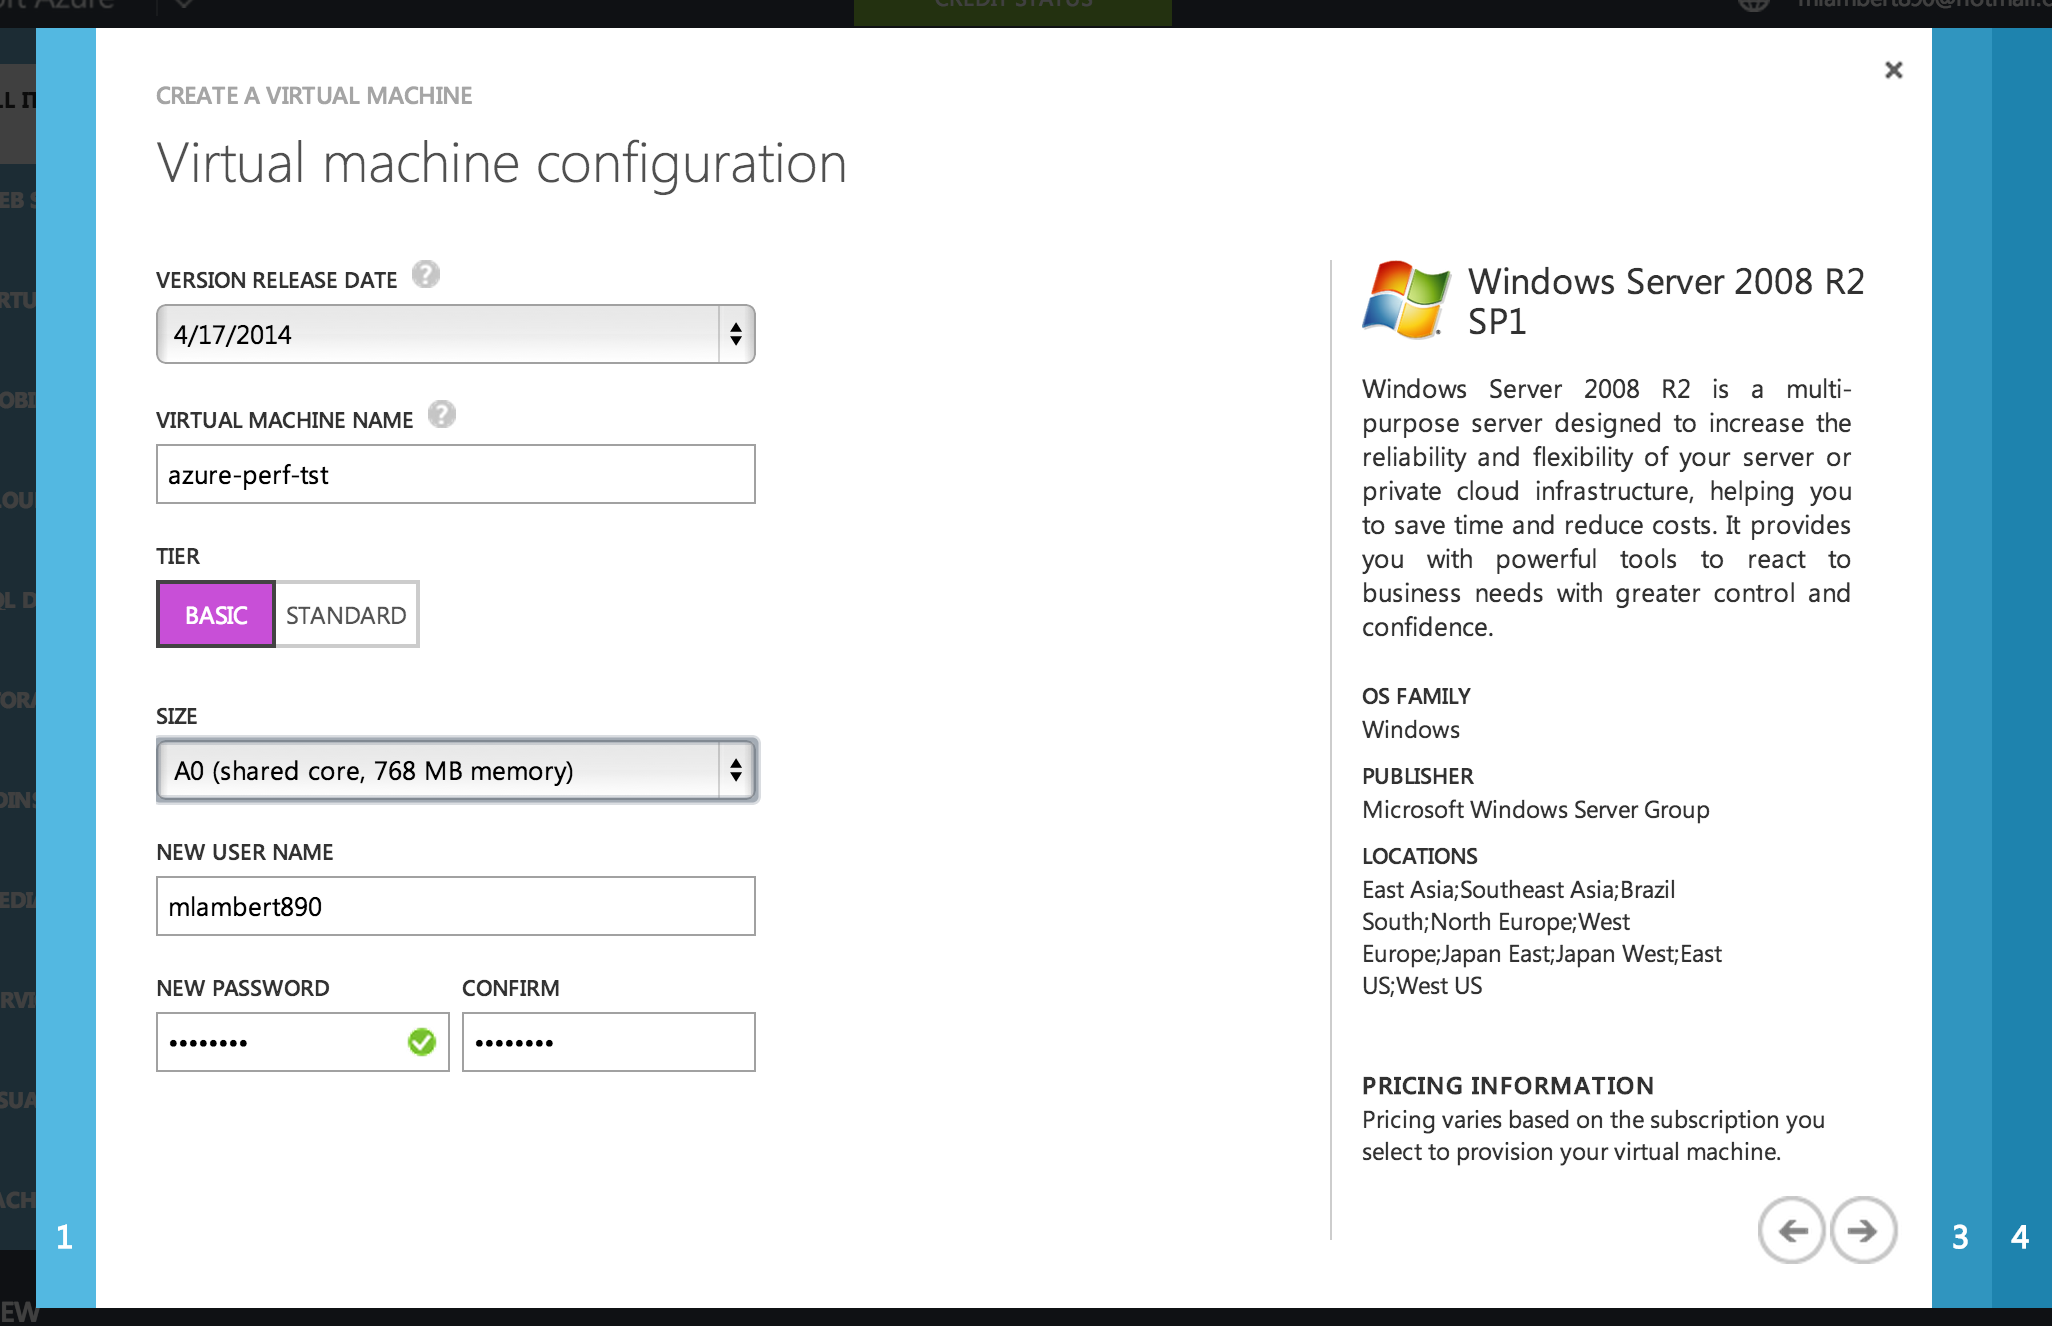
Screen 2: Next we get to configure our base VM. This where we see the t-shirt size menu and get to select a tier. I select “Basic” and the “A0” VM in order to attempt to map to t1.micro free tier.
Screen 3: Finally we set a name for our VM and provide both a user account and password. The new Windows VM will be configured with the credentials provided here as the configured administrative user automatically.
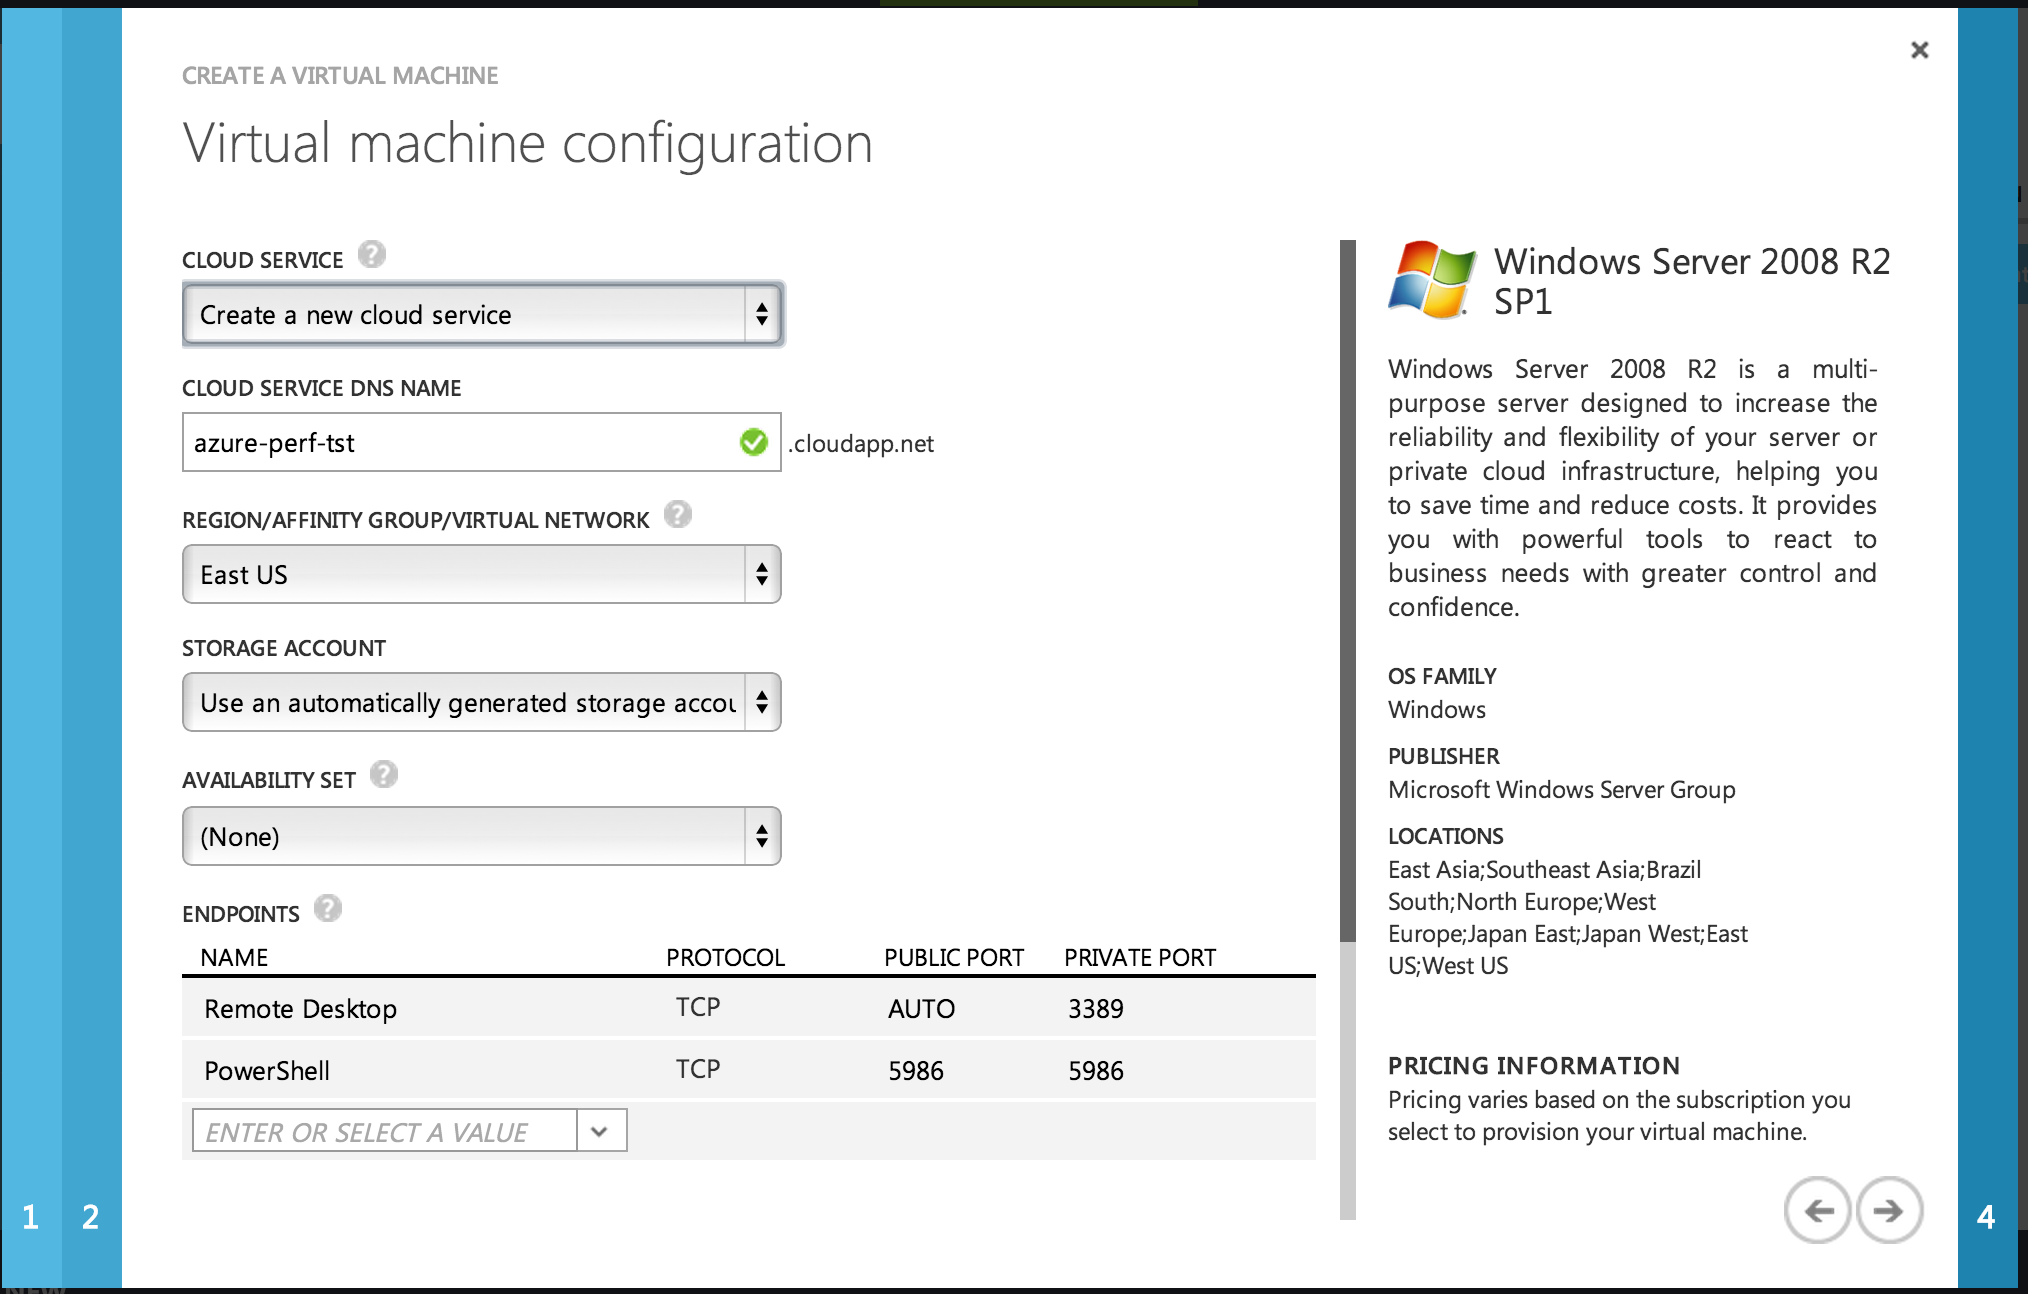
Screen 1: Next up things get interesting. We have the option of either adding our VM to an existing “Cloud Service” definition, or creating a new one. We can also provide an external DNS name for the service. Once again, the service centric PaaS roots show here and this would be very convenient stuff if we were building a real solution. Similar, the “Availability Set” option allows us to create an automatic high availability group. This would be most similar to “Autoscale” combined with “Elastic Load Balancer” on AWS. Of course your application would have to be written to survive this type of architecture meaning stateless, or distributed state, scale-out and elastic. We are also able to select a region and choose a Storage Account. In my case the only option was to use the “Automatically Generated Storage”, presumably because I do not have any previously configured storage instances. Last up we can set some firewall rules for our new VM which map most closely to AWS Security Groups. So far Azure IaaS is definitely much more cloud pattern focused (like AWS) than legacy virtualization/enterprise pattern focused (like vCHS).
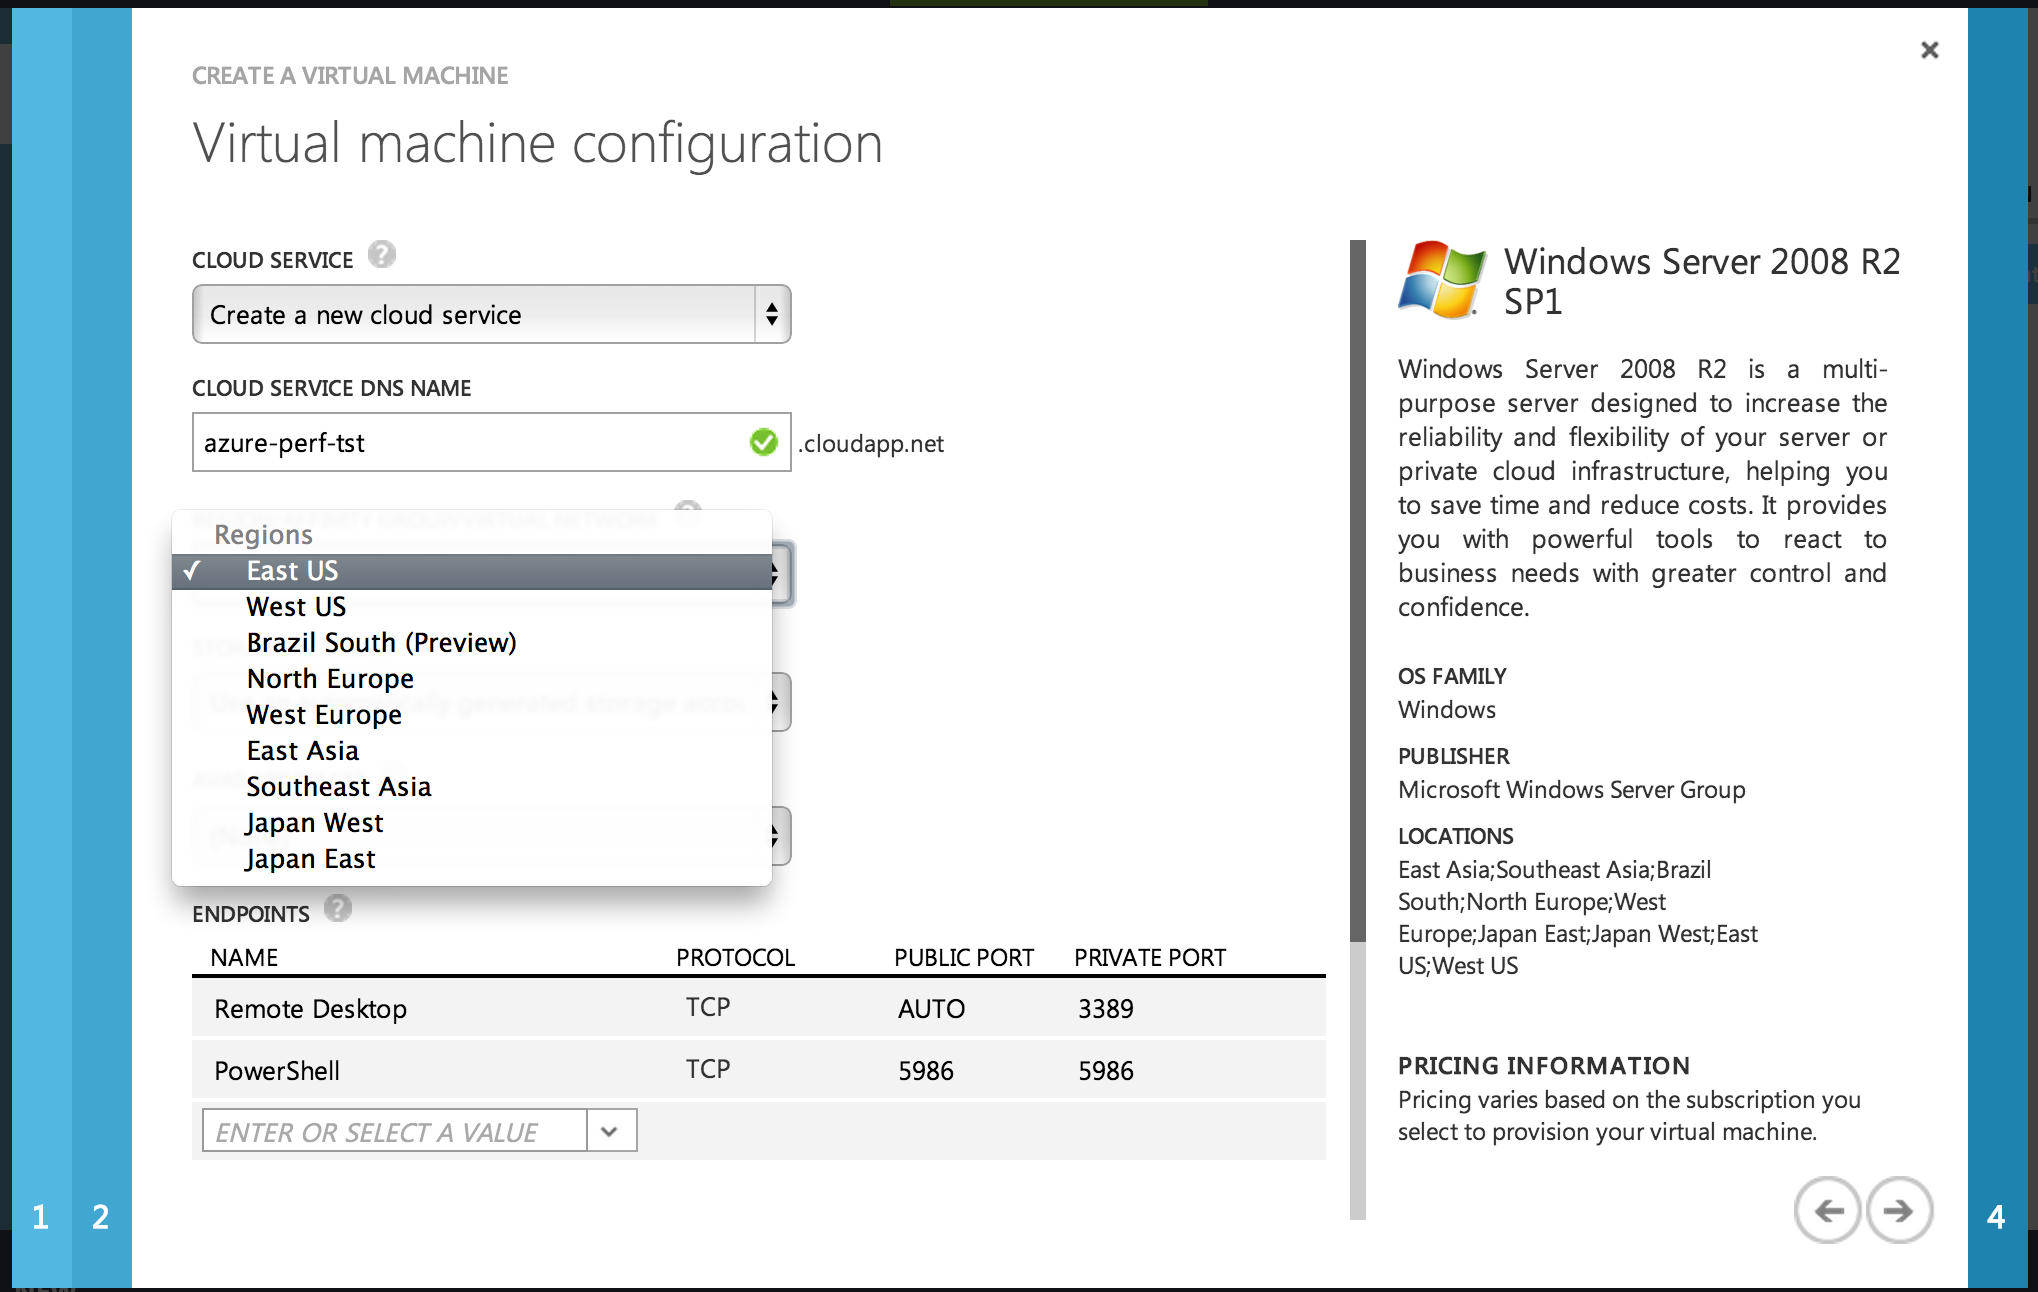
Screen 2: Here we can see the available currently selectable Azure regions. Pretty decent global footprint, but following the Amazon model of breadth “East/West” rather than depth (NY, Chicago, DC, San Fran, etc) for geographic presence. How much this matters really depends on what you are trying to accomplish.
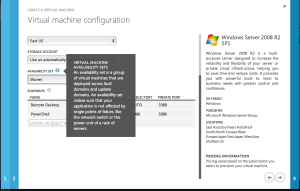
Screen 3: This is the tool-tip definition of “Availability Set”. I wanted to show this in Microsofts words. The interesting thing is that there isn’t really an explanation of exactly what “fault and update domains” are here. We can infer from the general description, but prior knowledge would definitely be required before diving into taking this architecture approach. Of course that’s not an unreasonable ask from a solution design point of view.
![]()
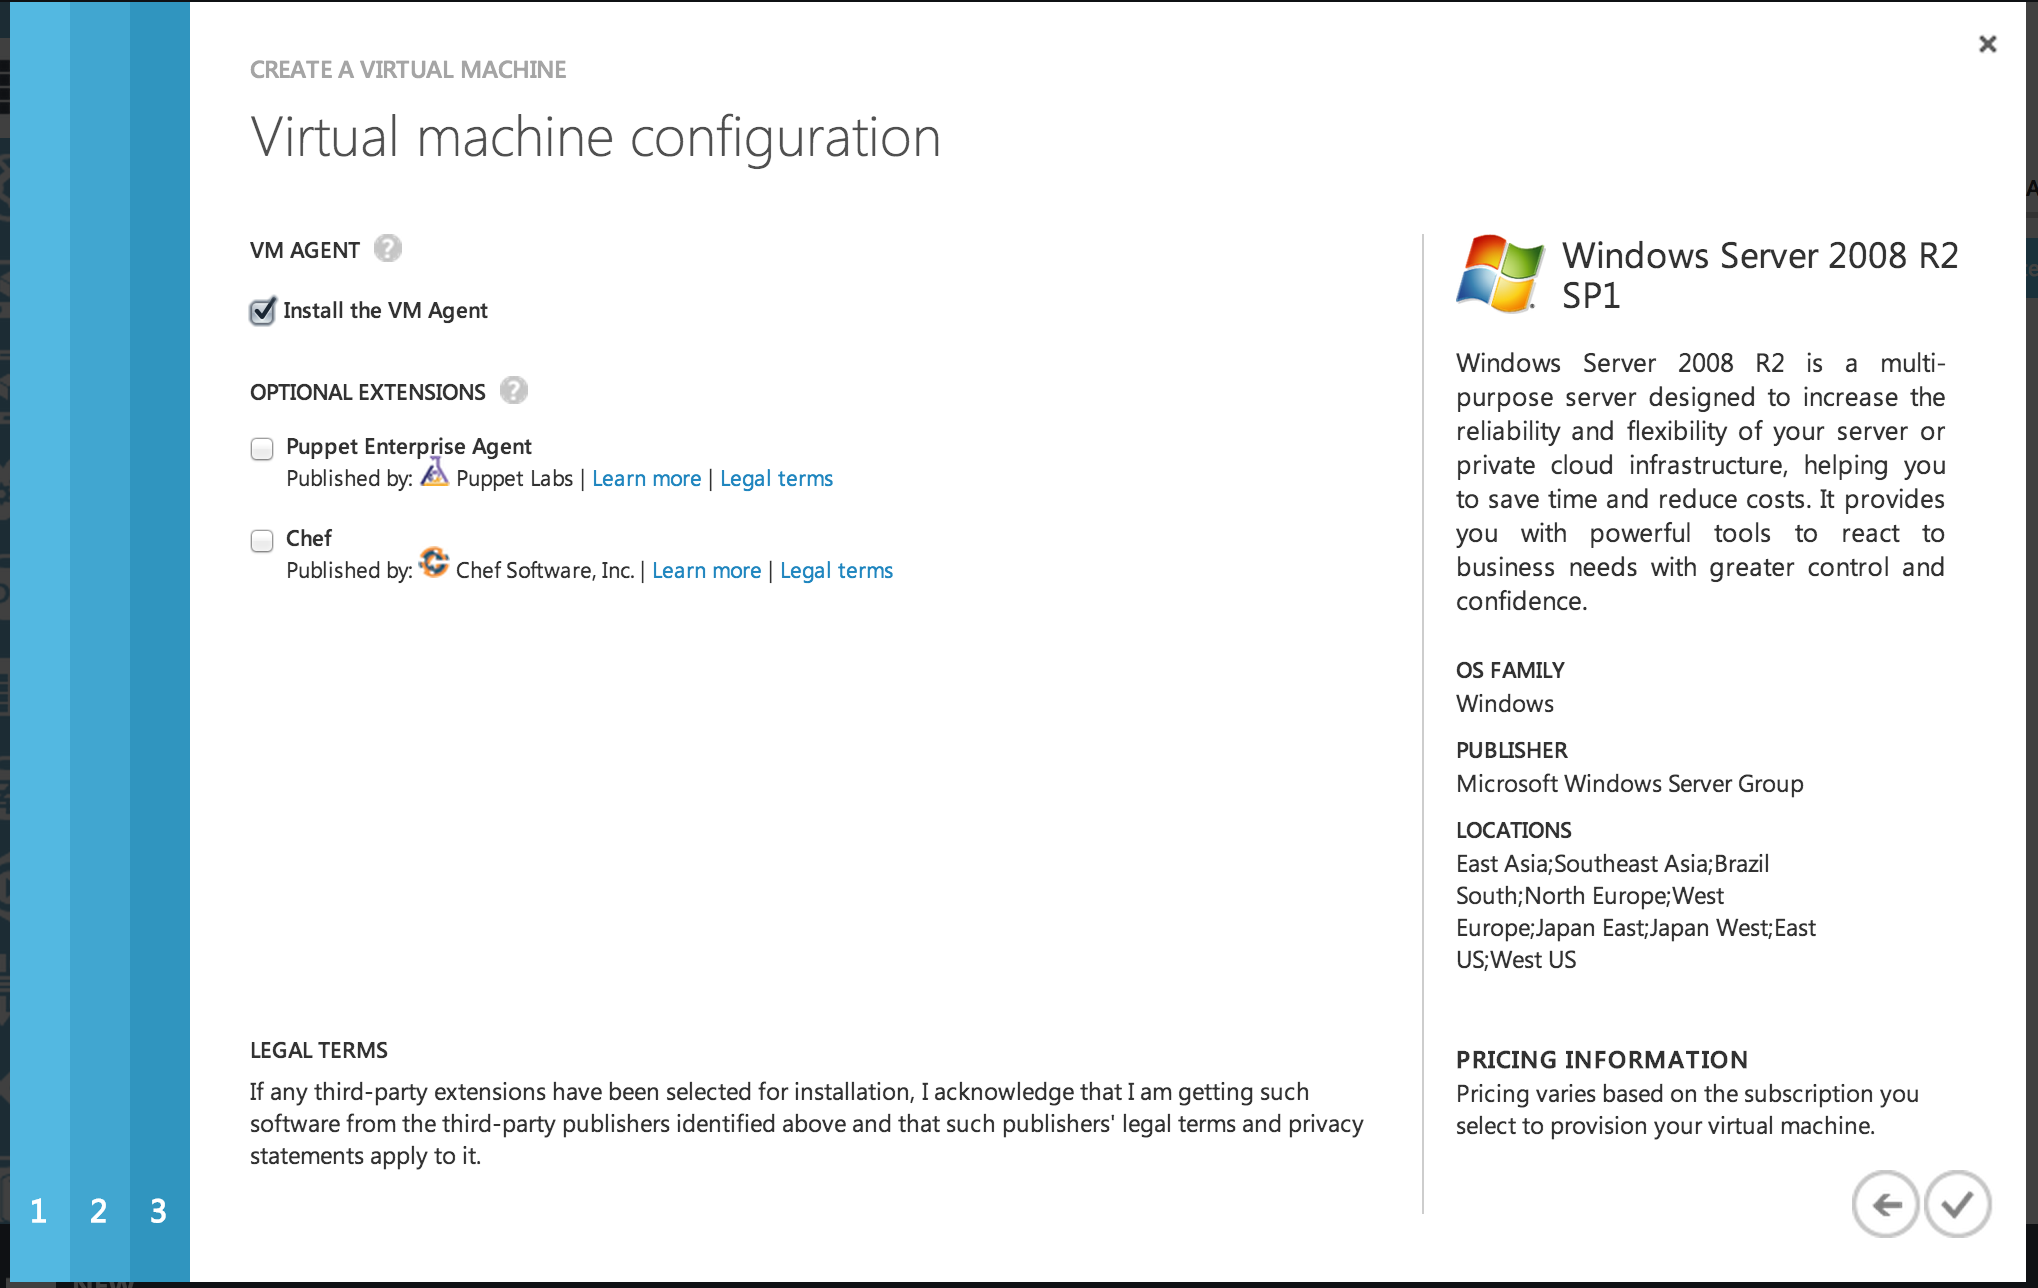
Screen 1: This is an extremely interesting screen. Here we have the option of installing up front one or more configuration management agents. Default selected is the native Azure agent, but Chef and Puppet are also selectable. I am moving forward with the default, but exploring the Chef and Puppet capabilities, and measuring them against whatever configuration management is provided natively, is definitely another good topic for a deep dive entry.
Screen 2: With our options set, we click the check mark and are returned to the console home screen where we can watch provisioning progress
Screen 3: The contest sensitive task bar changes focus to display real time updates on the workflow. This is cool and helps the (nearly 10 minutes of) time pass (a bit) more quickly
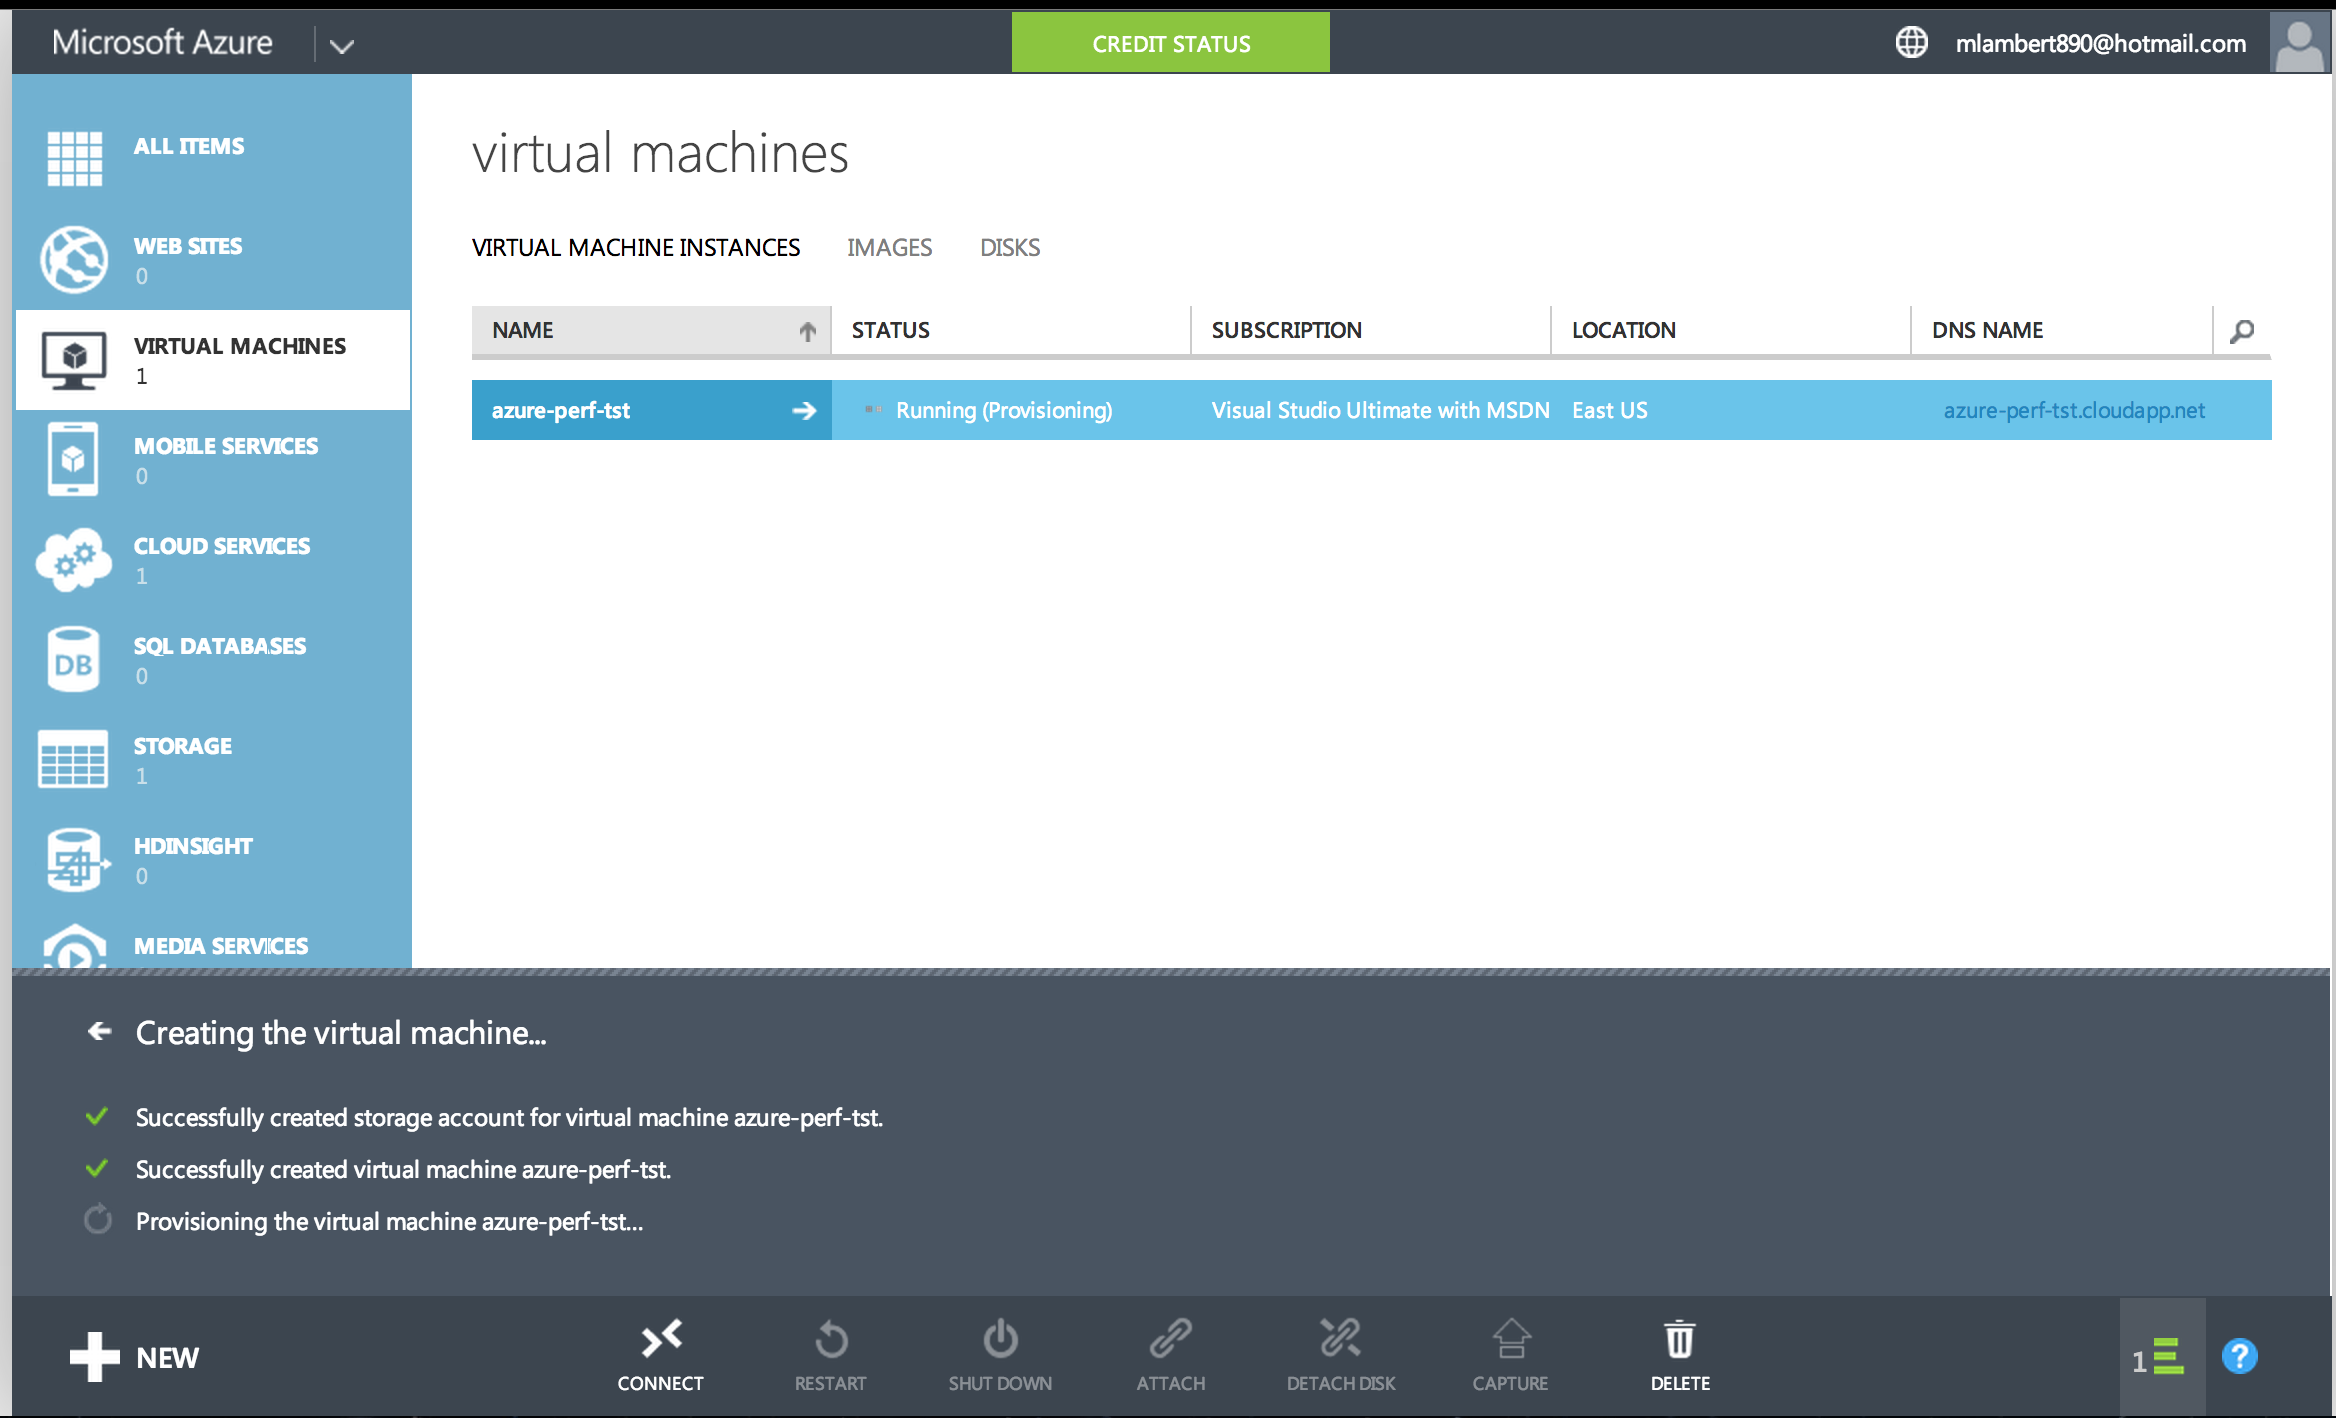
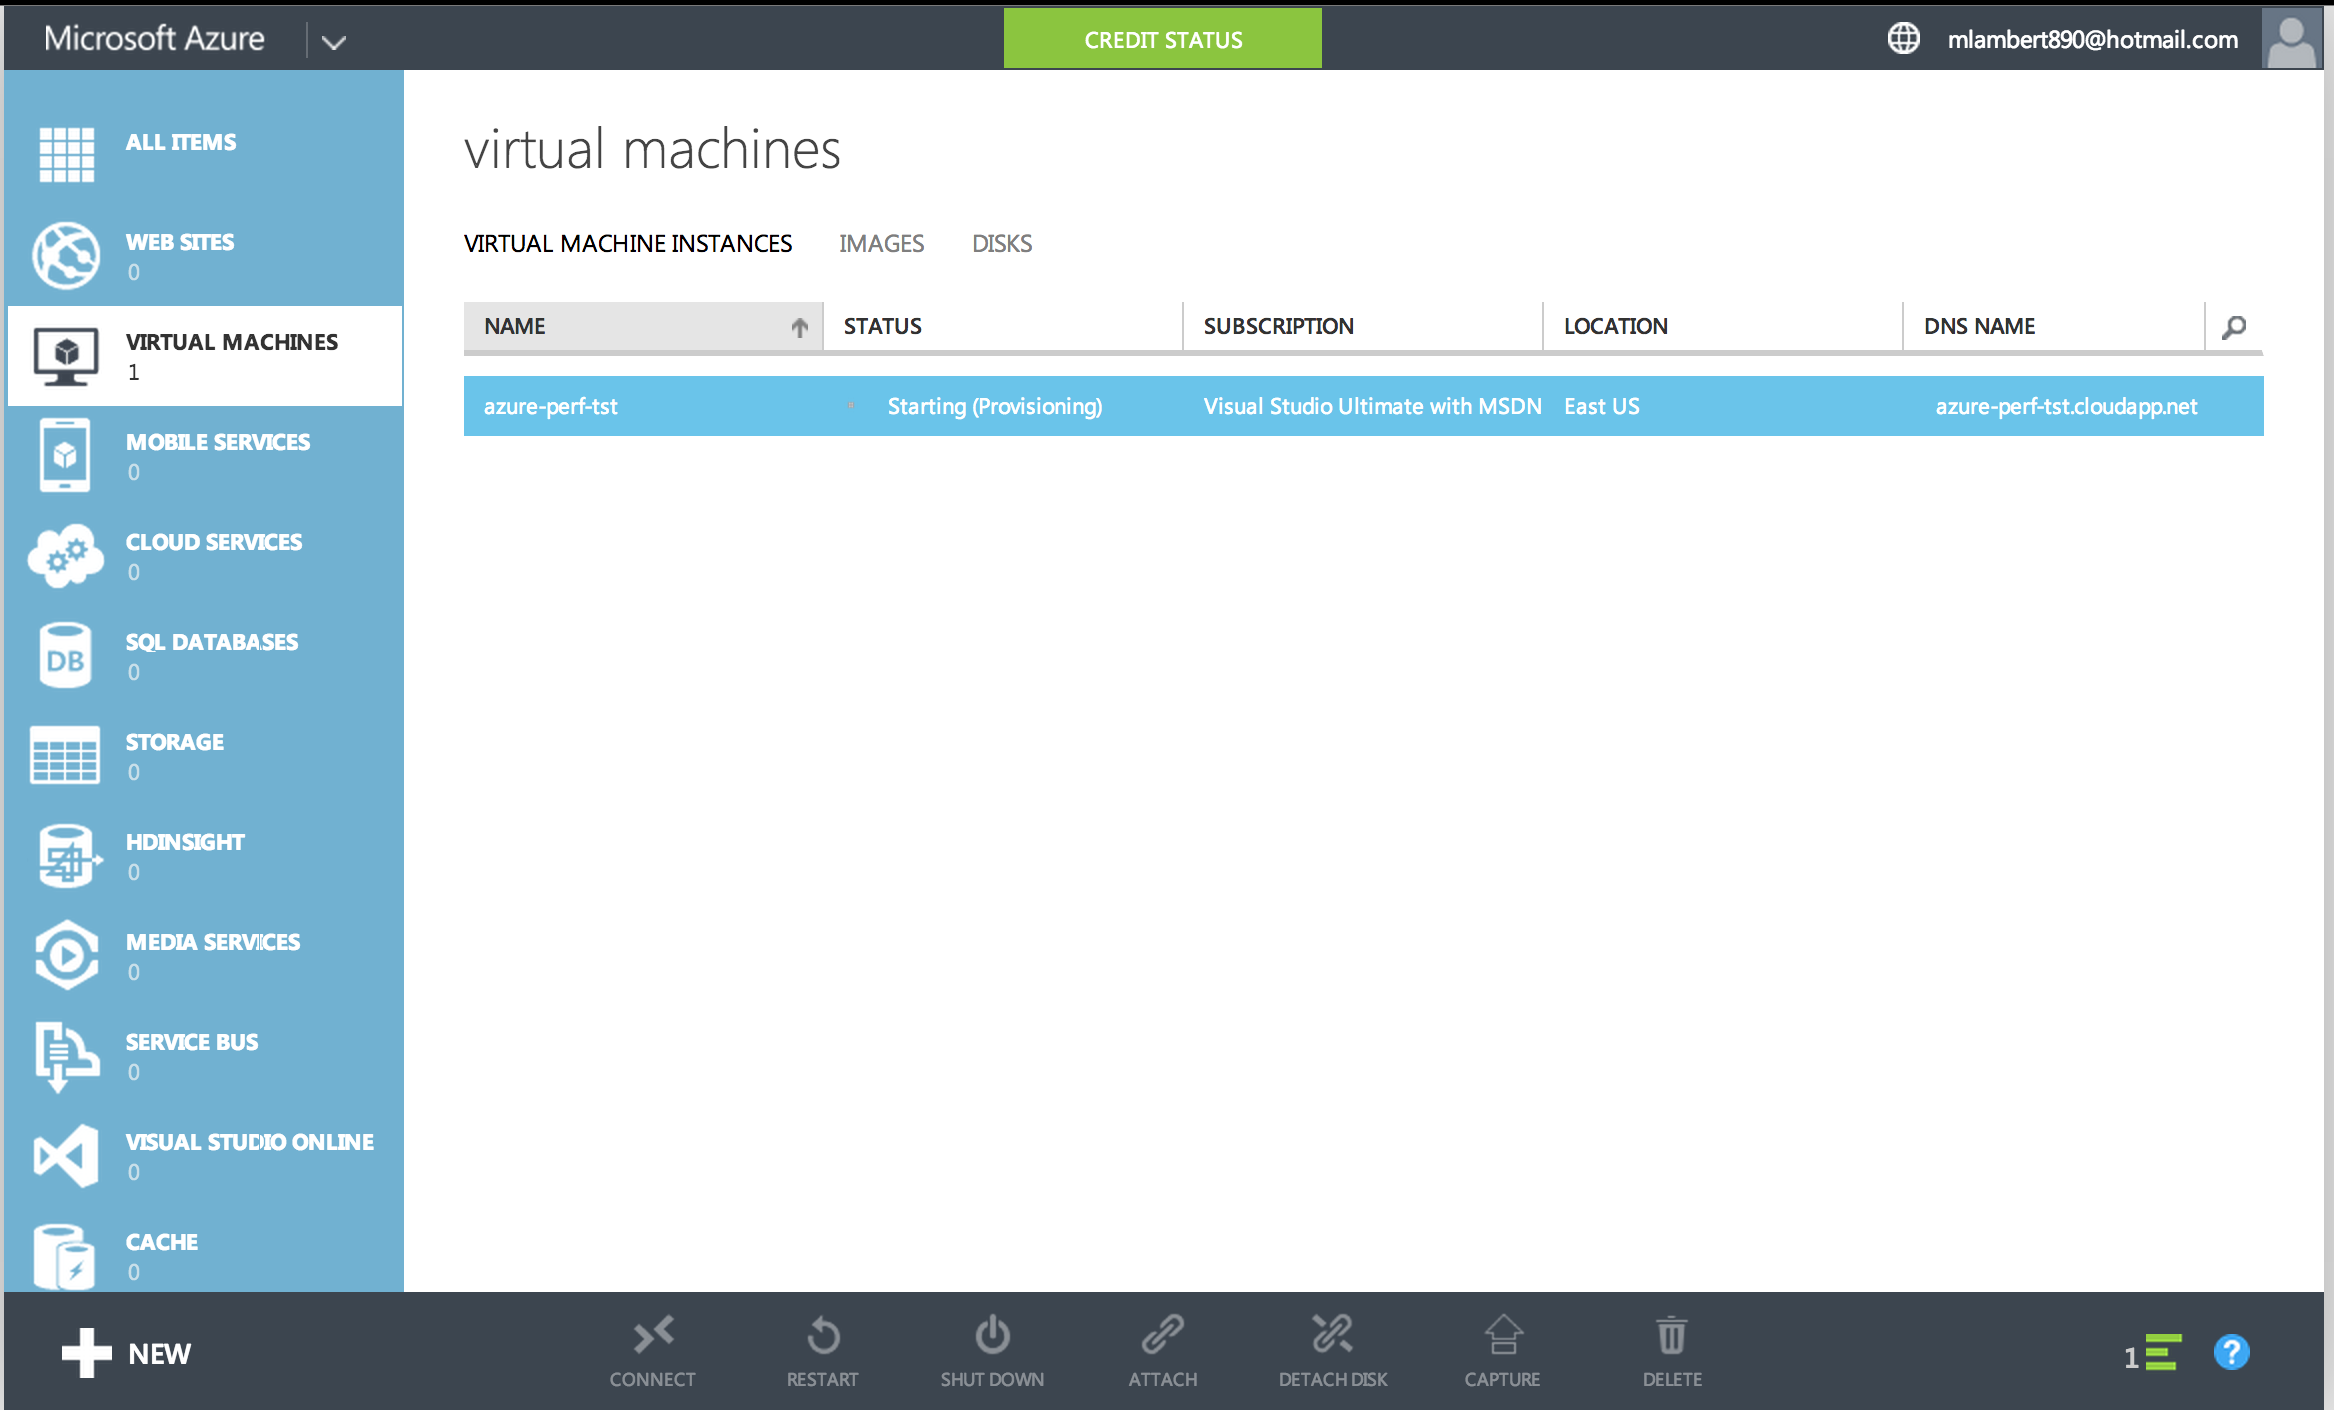
Screen 1: An expanded view of the workflow status with the discrete task showing – “Creating the Virtual Machine” at this stage
Screen 2: Expanding that view a level deeper we get some step-by-step guidance. This is awesome and provides insight into how the provisioning flow actually works. AWS provides similar, but less granular, status in the EC2 console. I think the checklist presentation here is really great.
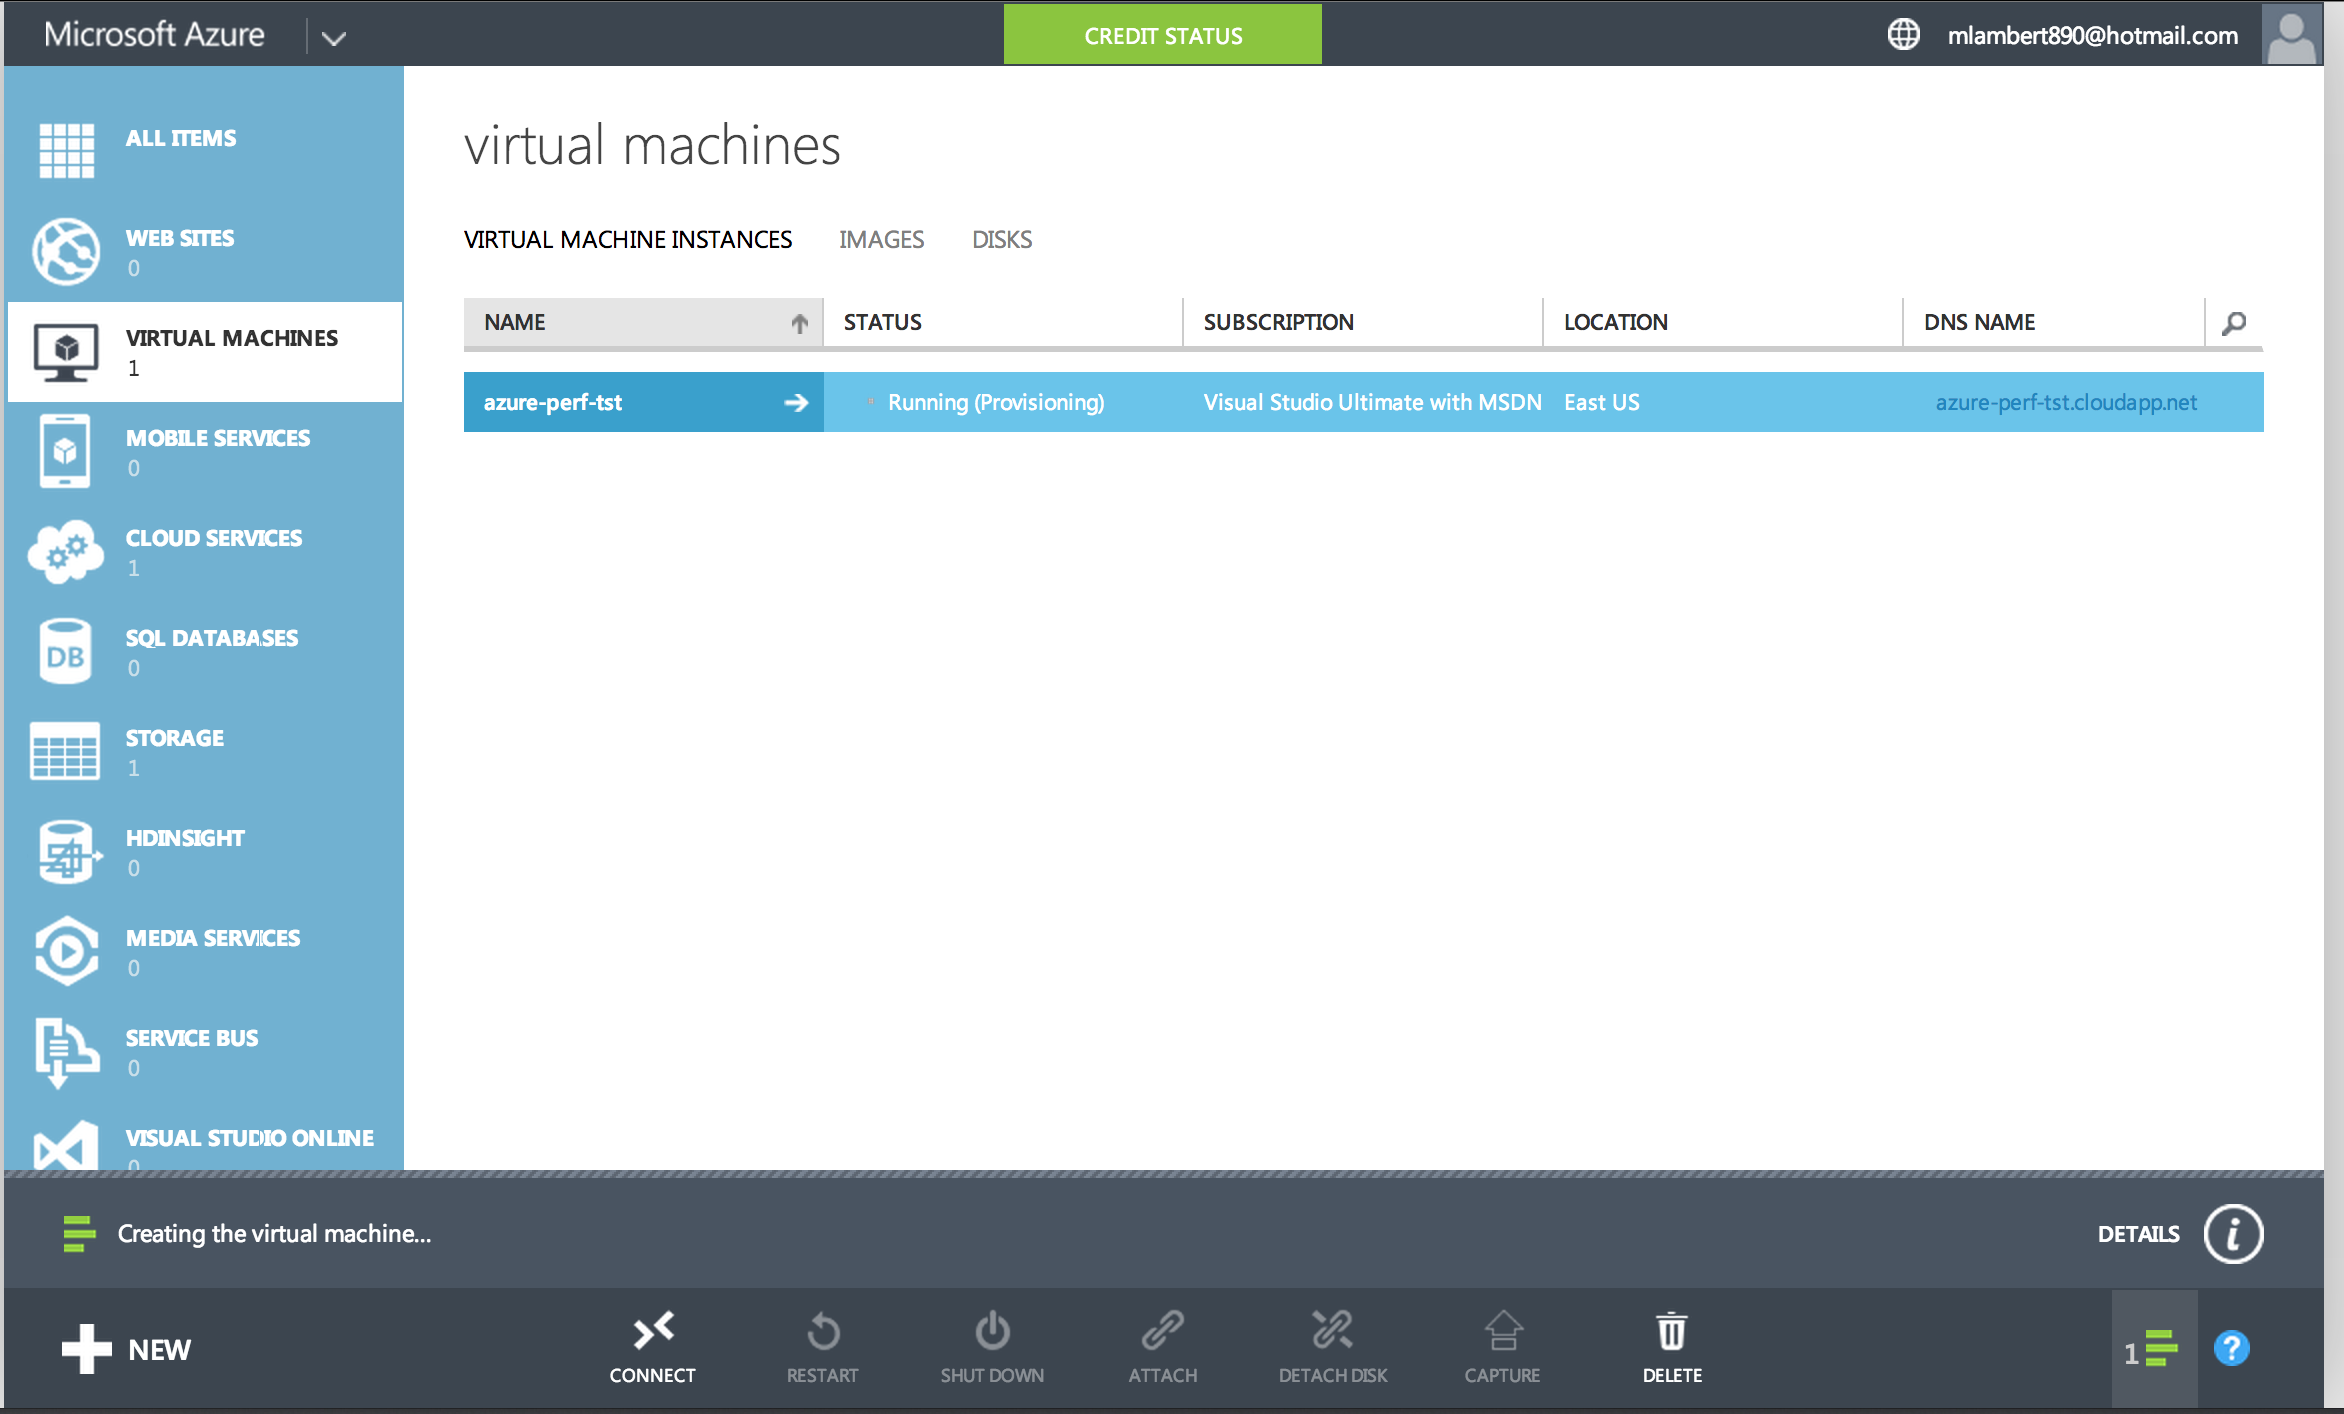
Screen 3: At this point we had reached the 7:45 mark and the VM was created, but Azure wasn’t fully done. “Installing extensions” went on for another 2 minutes and as mentioned above I kept the timer running until we got the actually complete message.
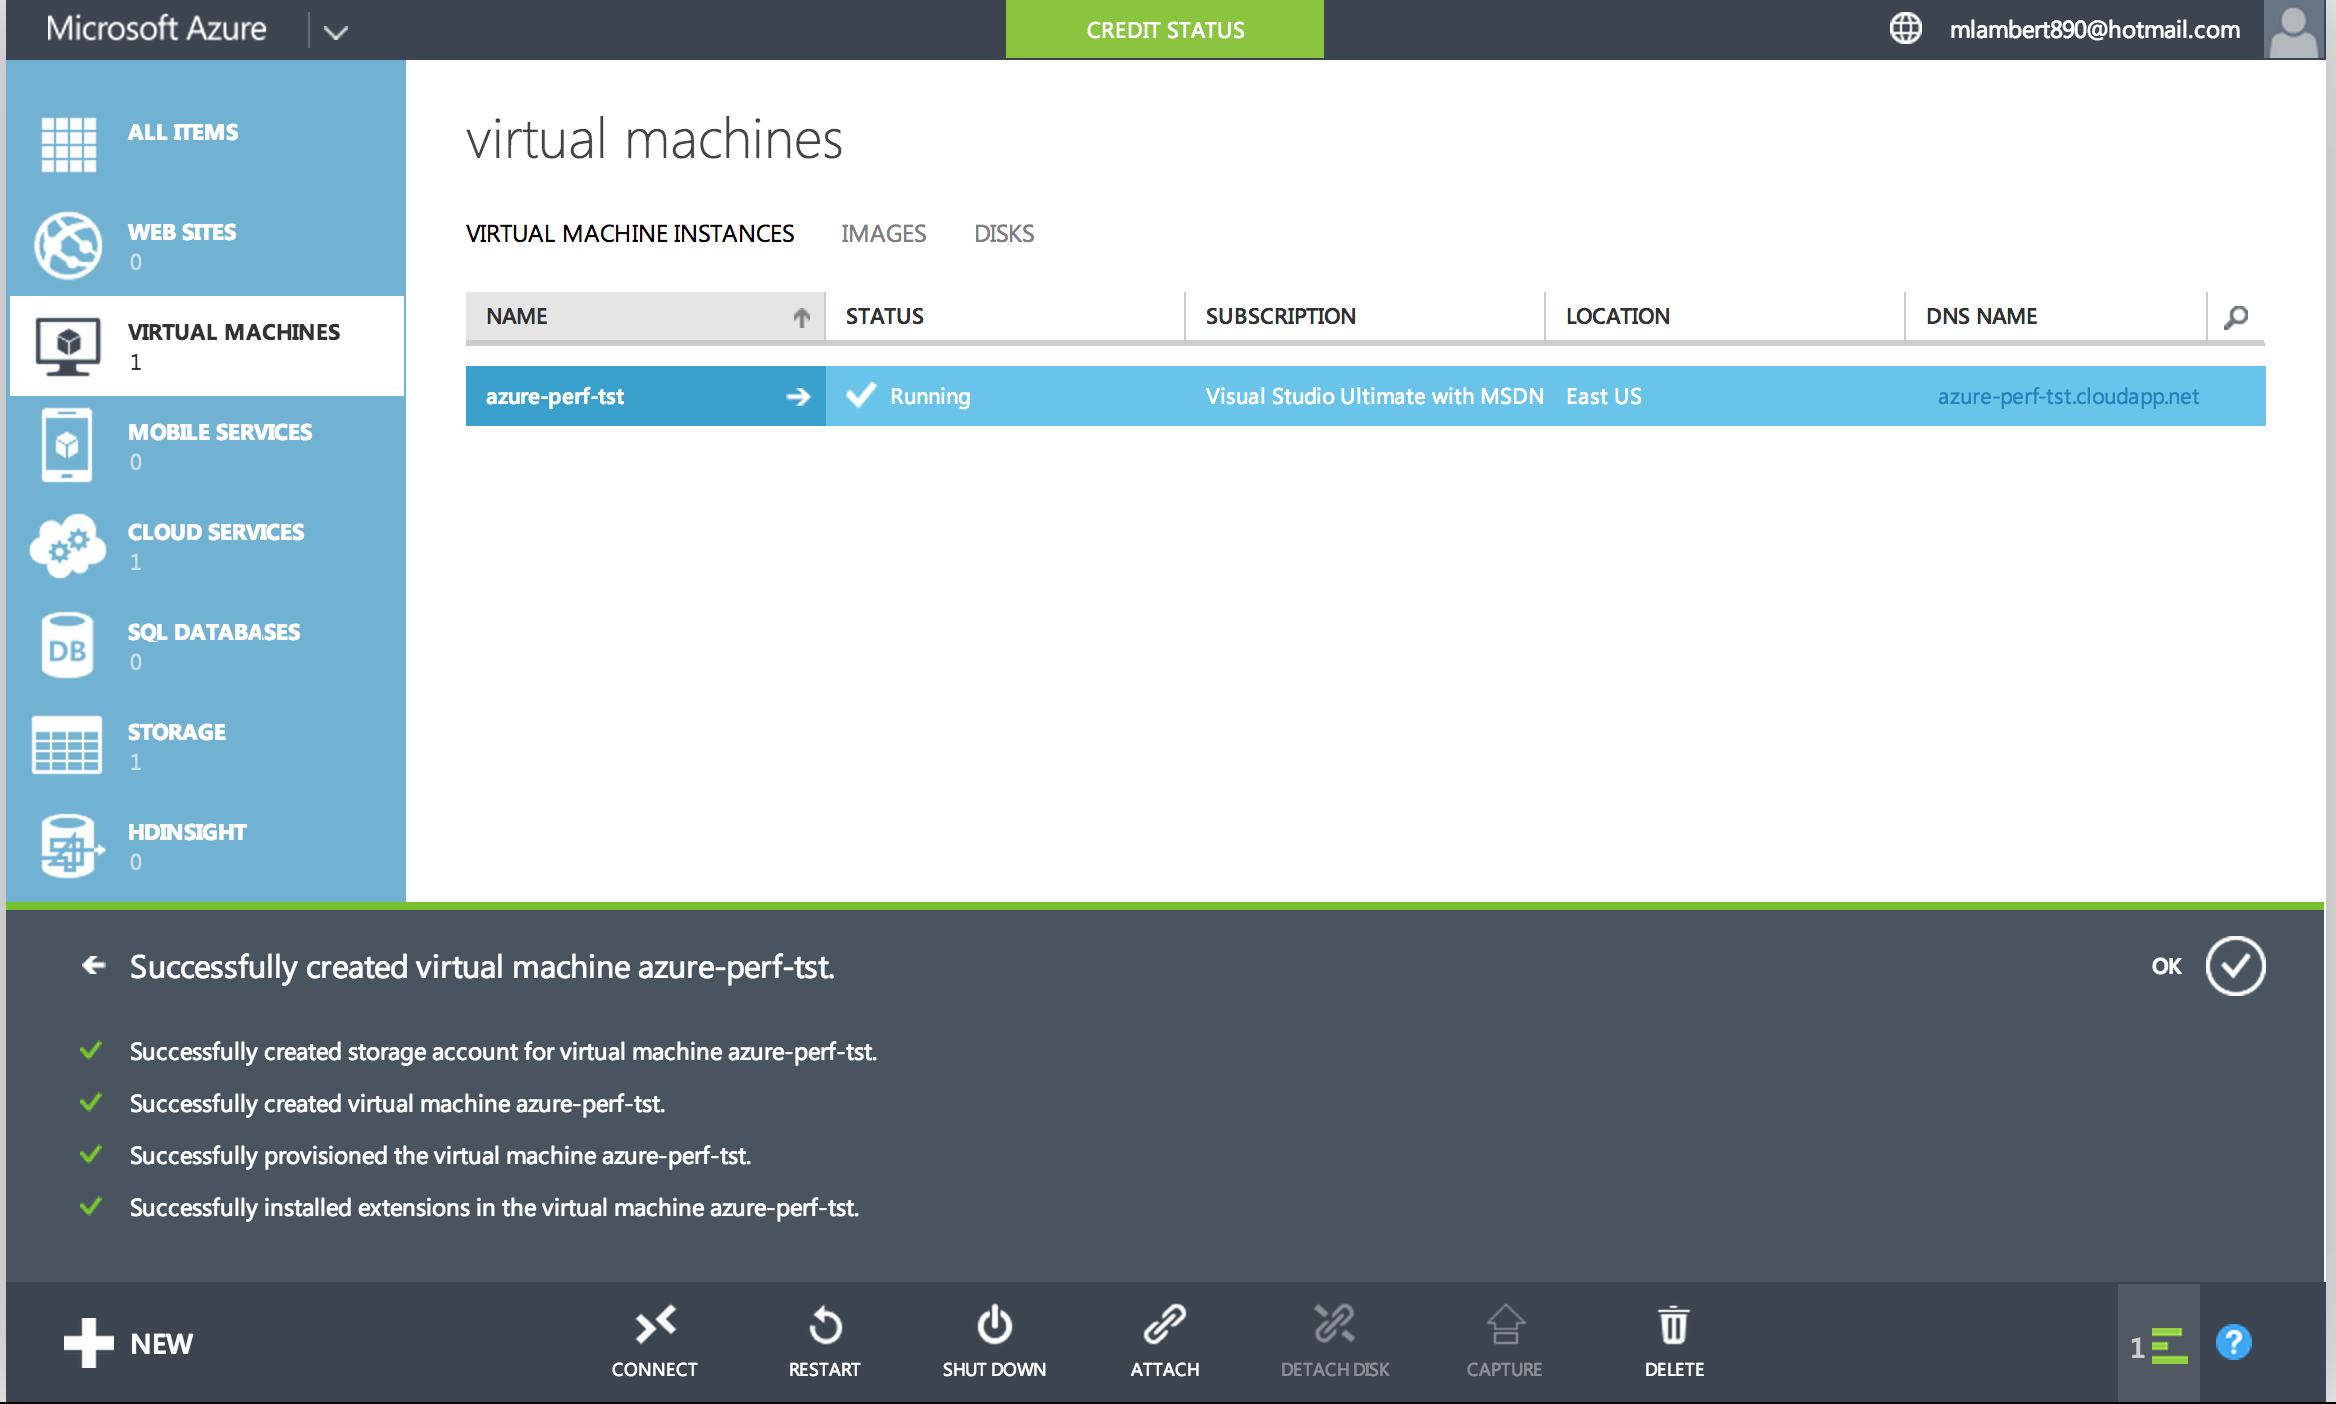

Screen 1: Here we see the VM finally finished and ready for access. Hurray! That took a while.
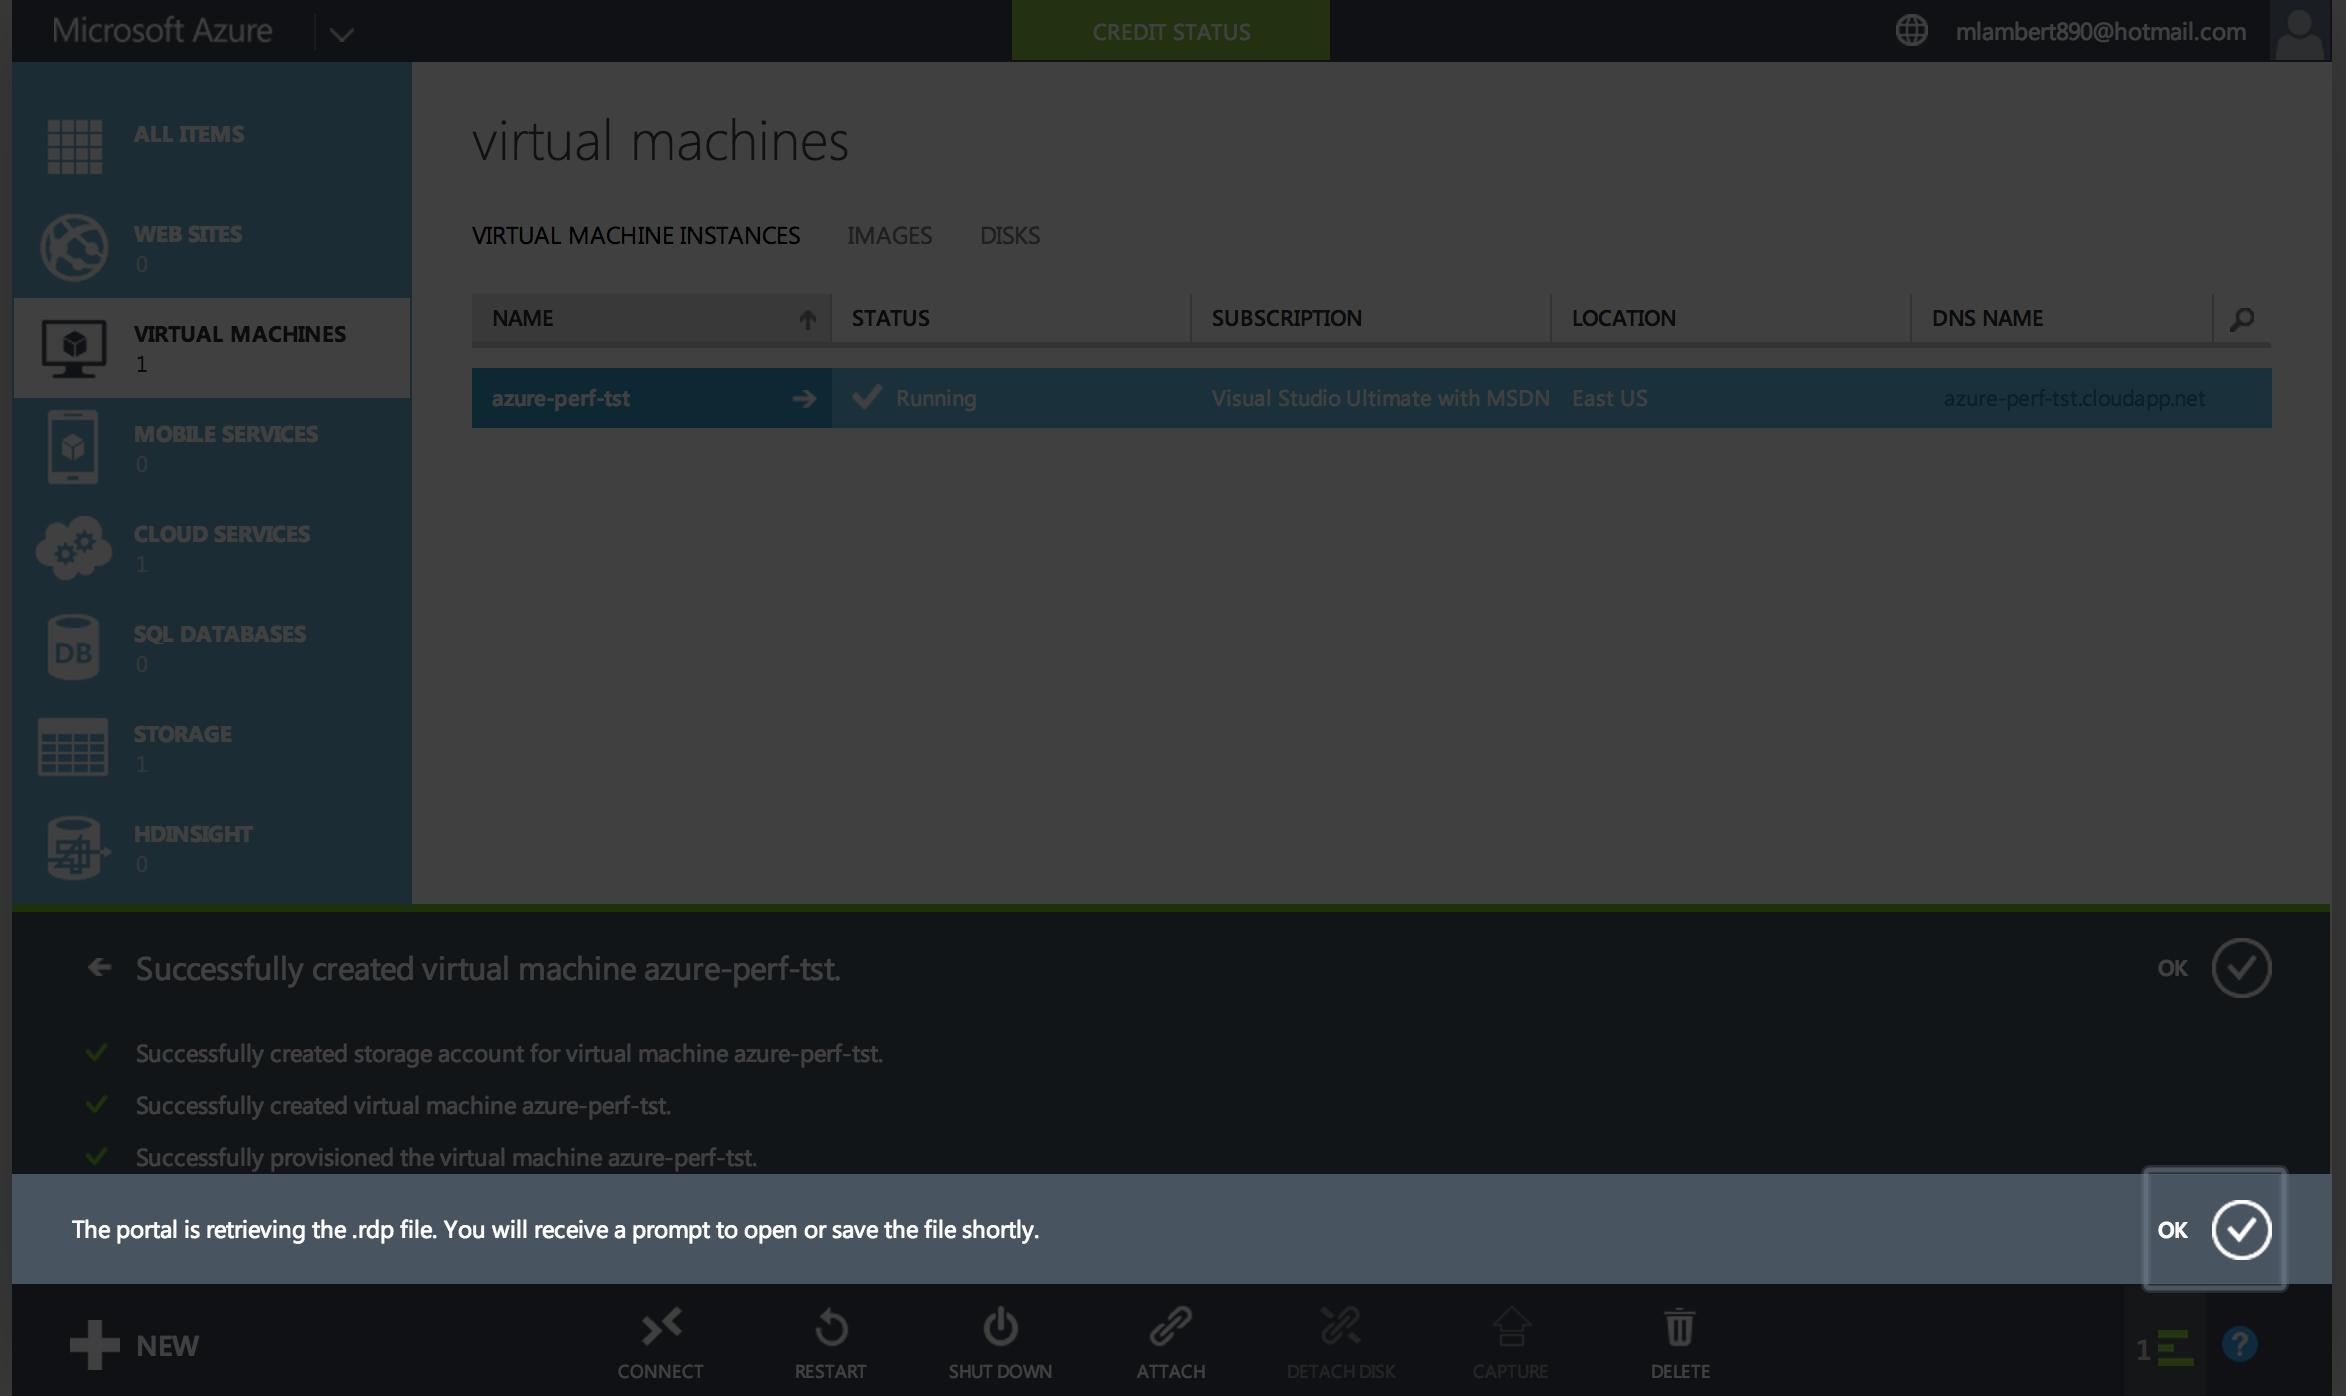
Screen 2: Clicking connect, we download a .RDP file. Microsoft centric reflex showing for the first time here. Of course it’s not a surprise that RDP would be expected for connecting to the Windows instance, and AWS does this as well, but VMware does this better with the extremely cool, and platform agnostic, VMRC (Virtual Machine Remote Console) that has the added benefit of allowing you to observe the virtual machine pre-boot.
Screen 3: And… we’ve arrived! Our standard Windows 2008 R2 Azure desktop complete with a standard background that Azure stole from AWS but which AWS had stolen from Microsoft (so that’s fair)
So What’s Under the Hood?
At this stage our Windows server is up, so what did CPU-Z find? Very interesting results actually. Breaking from the pattern, Azure spreads the love:
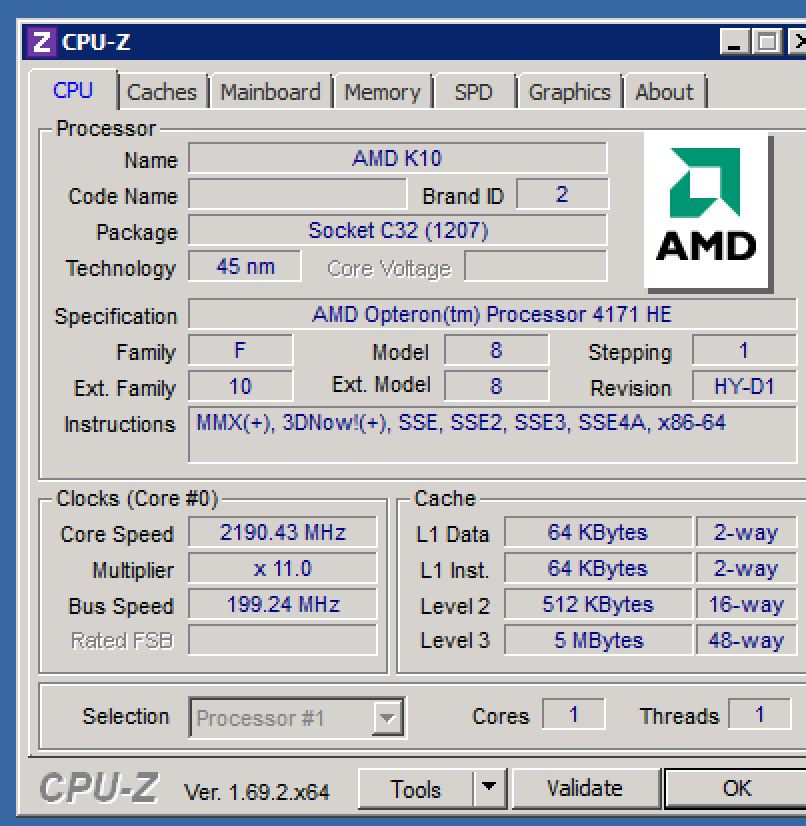
Holy smokes it’s AMD! AMD K10 series Opteron 4171 HE at 2.2Ghz with a 200Mhz FSB. Intel not inside! Can’t wait to see how the performance stacks up! I run some Bulldozer FX-8150s in the and they’re solid, but with cloud it all comes down to host subscription and implementation and our “A0” VM has the “shared core”. We shall see…
Network Download Performance
For the network download I chose to download PCMark 8 again (even though I expect the test won’t work) since it is a huge file and was used in the other entry. Azure had blistering network performance, matching vCHS, and even more interestingly were the results when I started a second download stream:
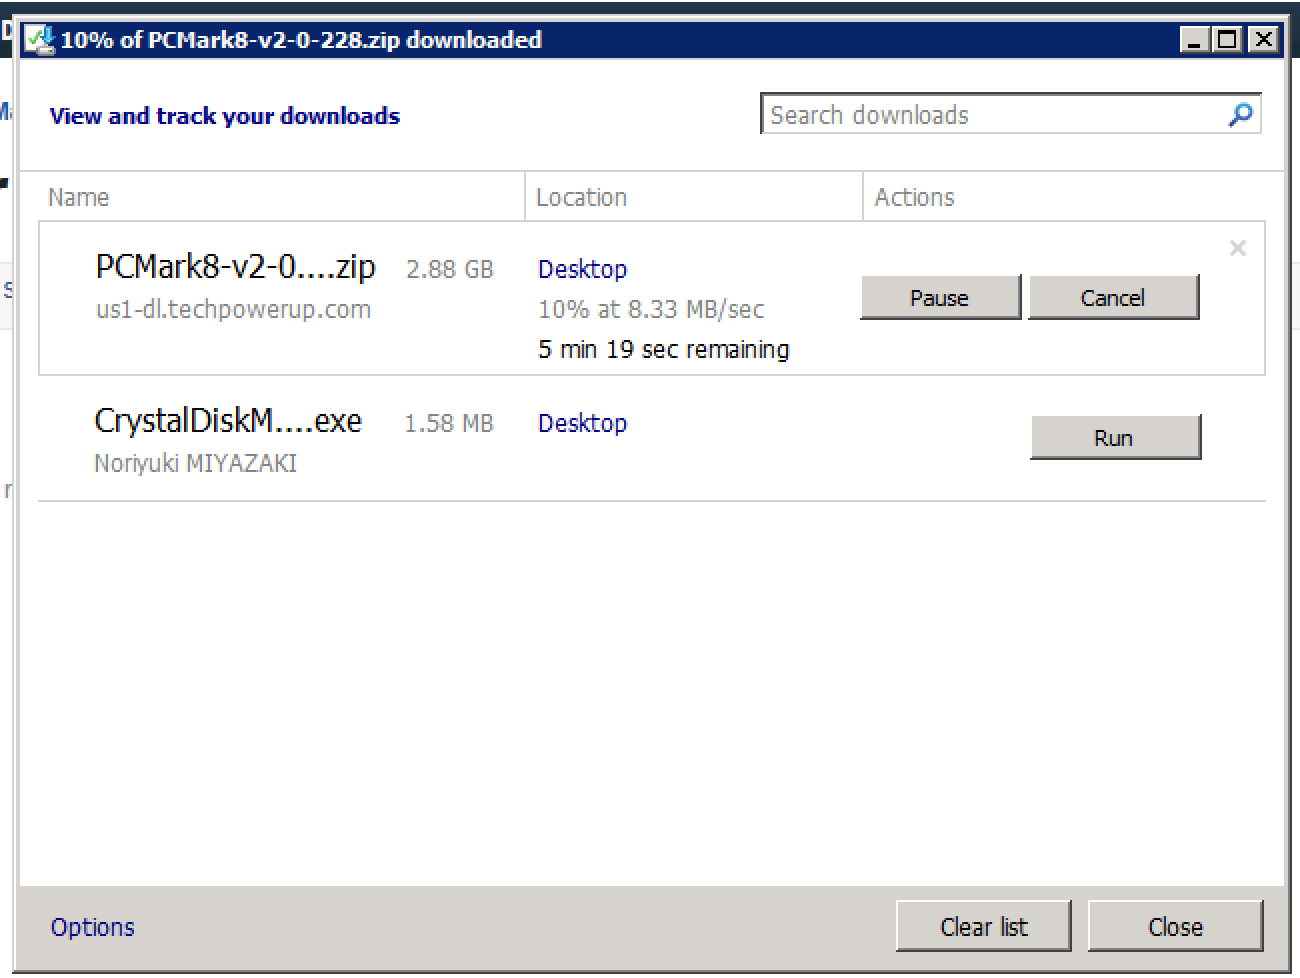
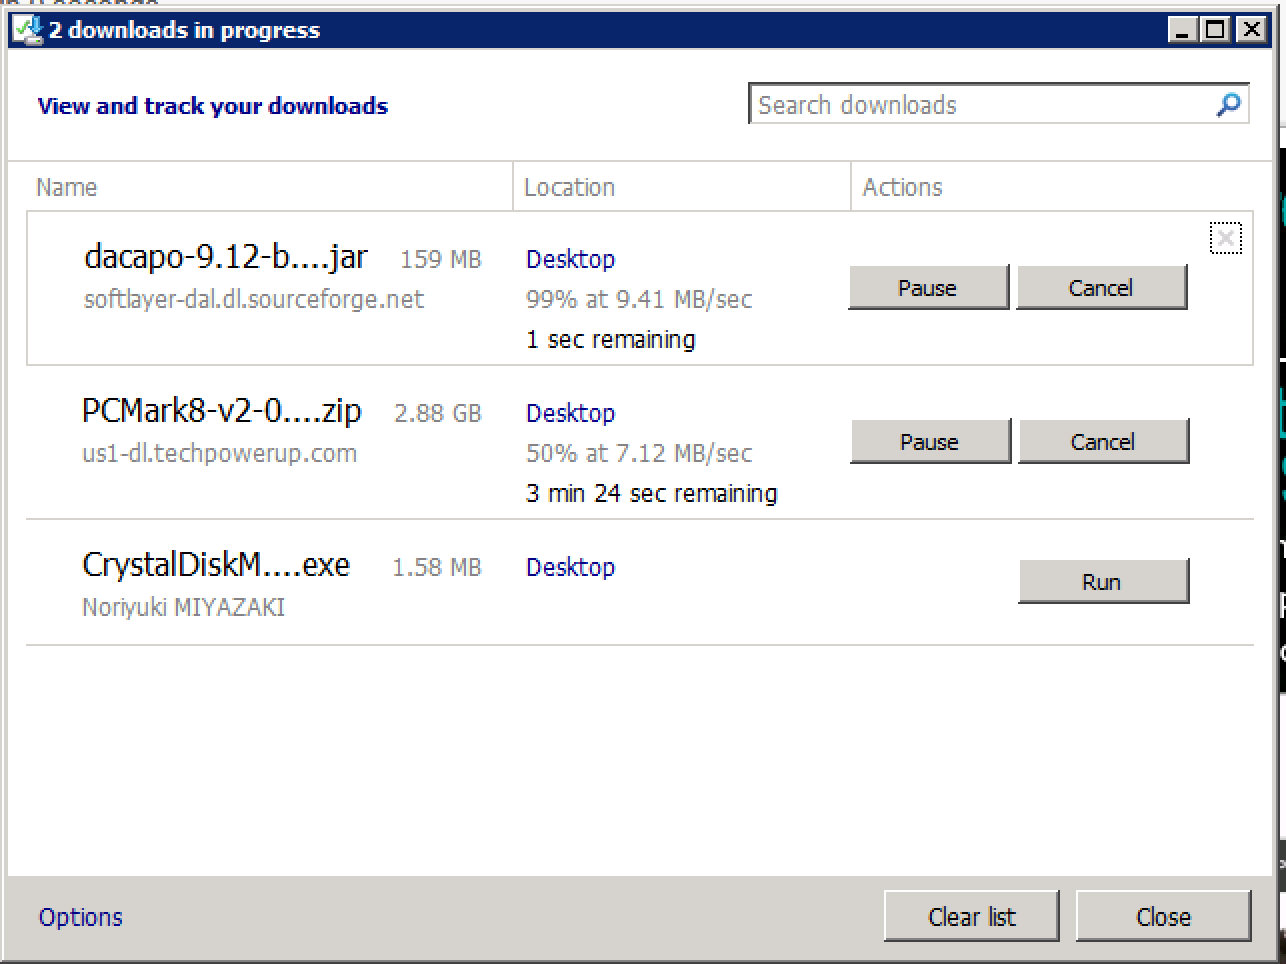
8.5MB/s, but a combined sustained throughput of nearly 17MB/s with the second stream. This gave me the idea to just go ahead and do a Speedtest for all three platforms. First up vCHS:
Holy crap! Um, ok. So vCHS is giving us a symmetric gigabit with 2ms ping. This is a pretty insane result. Keep in mind our vCHS testing tenant is dedicated and we don’t have much running on it, so this is an outlier. It definitely gives insight into what is possible however. This would be a rare site in any typical enterprise datacenter regardless of how many machines are online. Next up, EC2:

Wow! Another “holy crap” moment. I think this “cloud thing” is going to catch on! Close to reality here, but still a staggering result of roughly 120Mb/s symmetric with a 19ms ping from a free t1.micro instance on the heavily subscribed EC2 platform. This is just insane. Will Azure keep this momentum going? Let’s see. Next up, Azure:
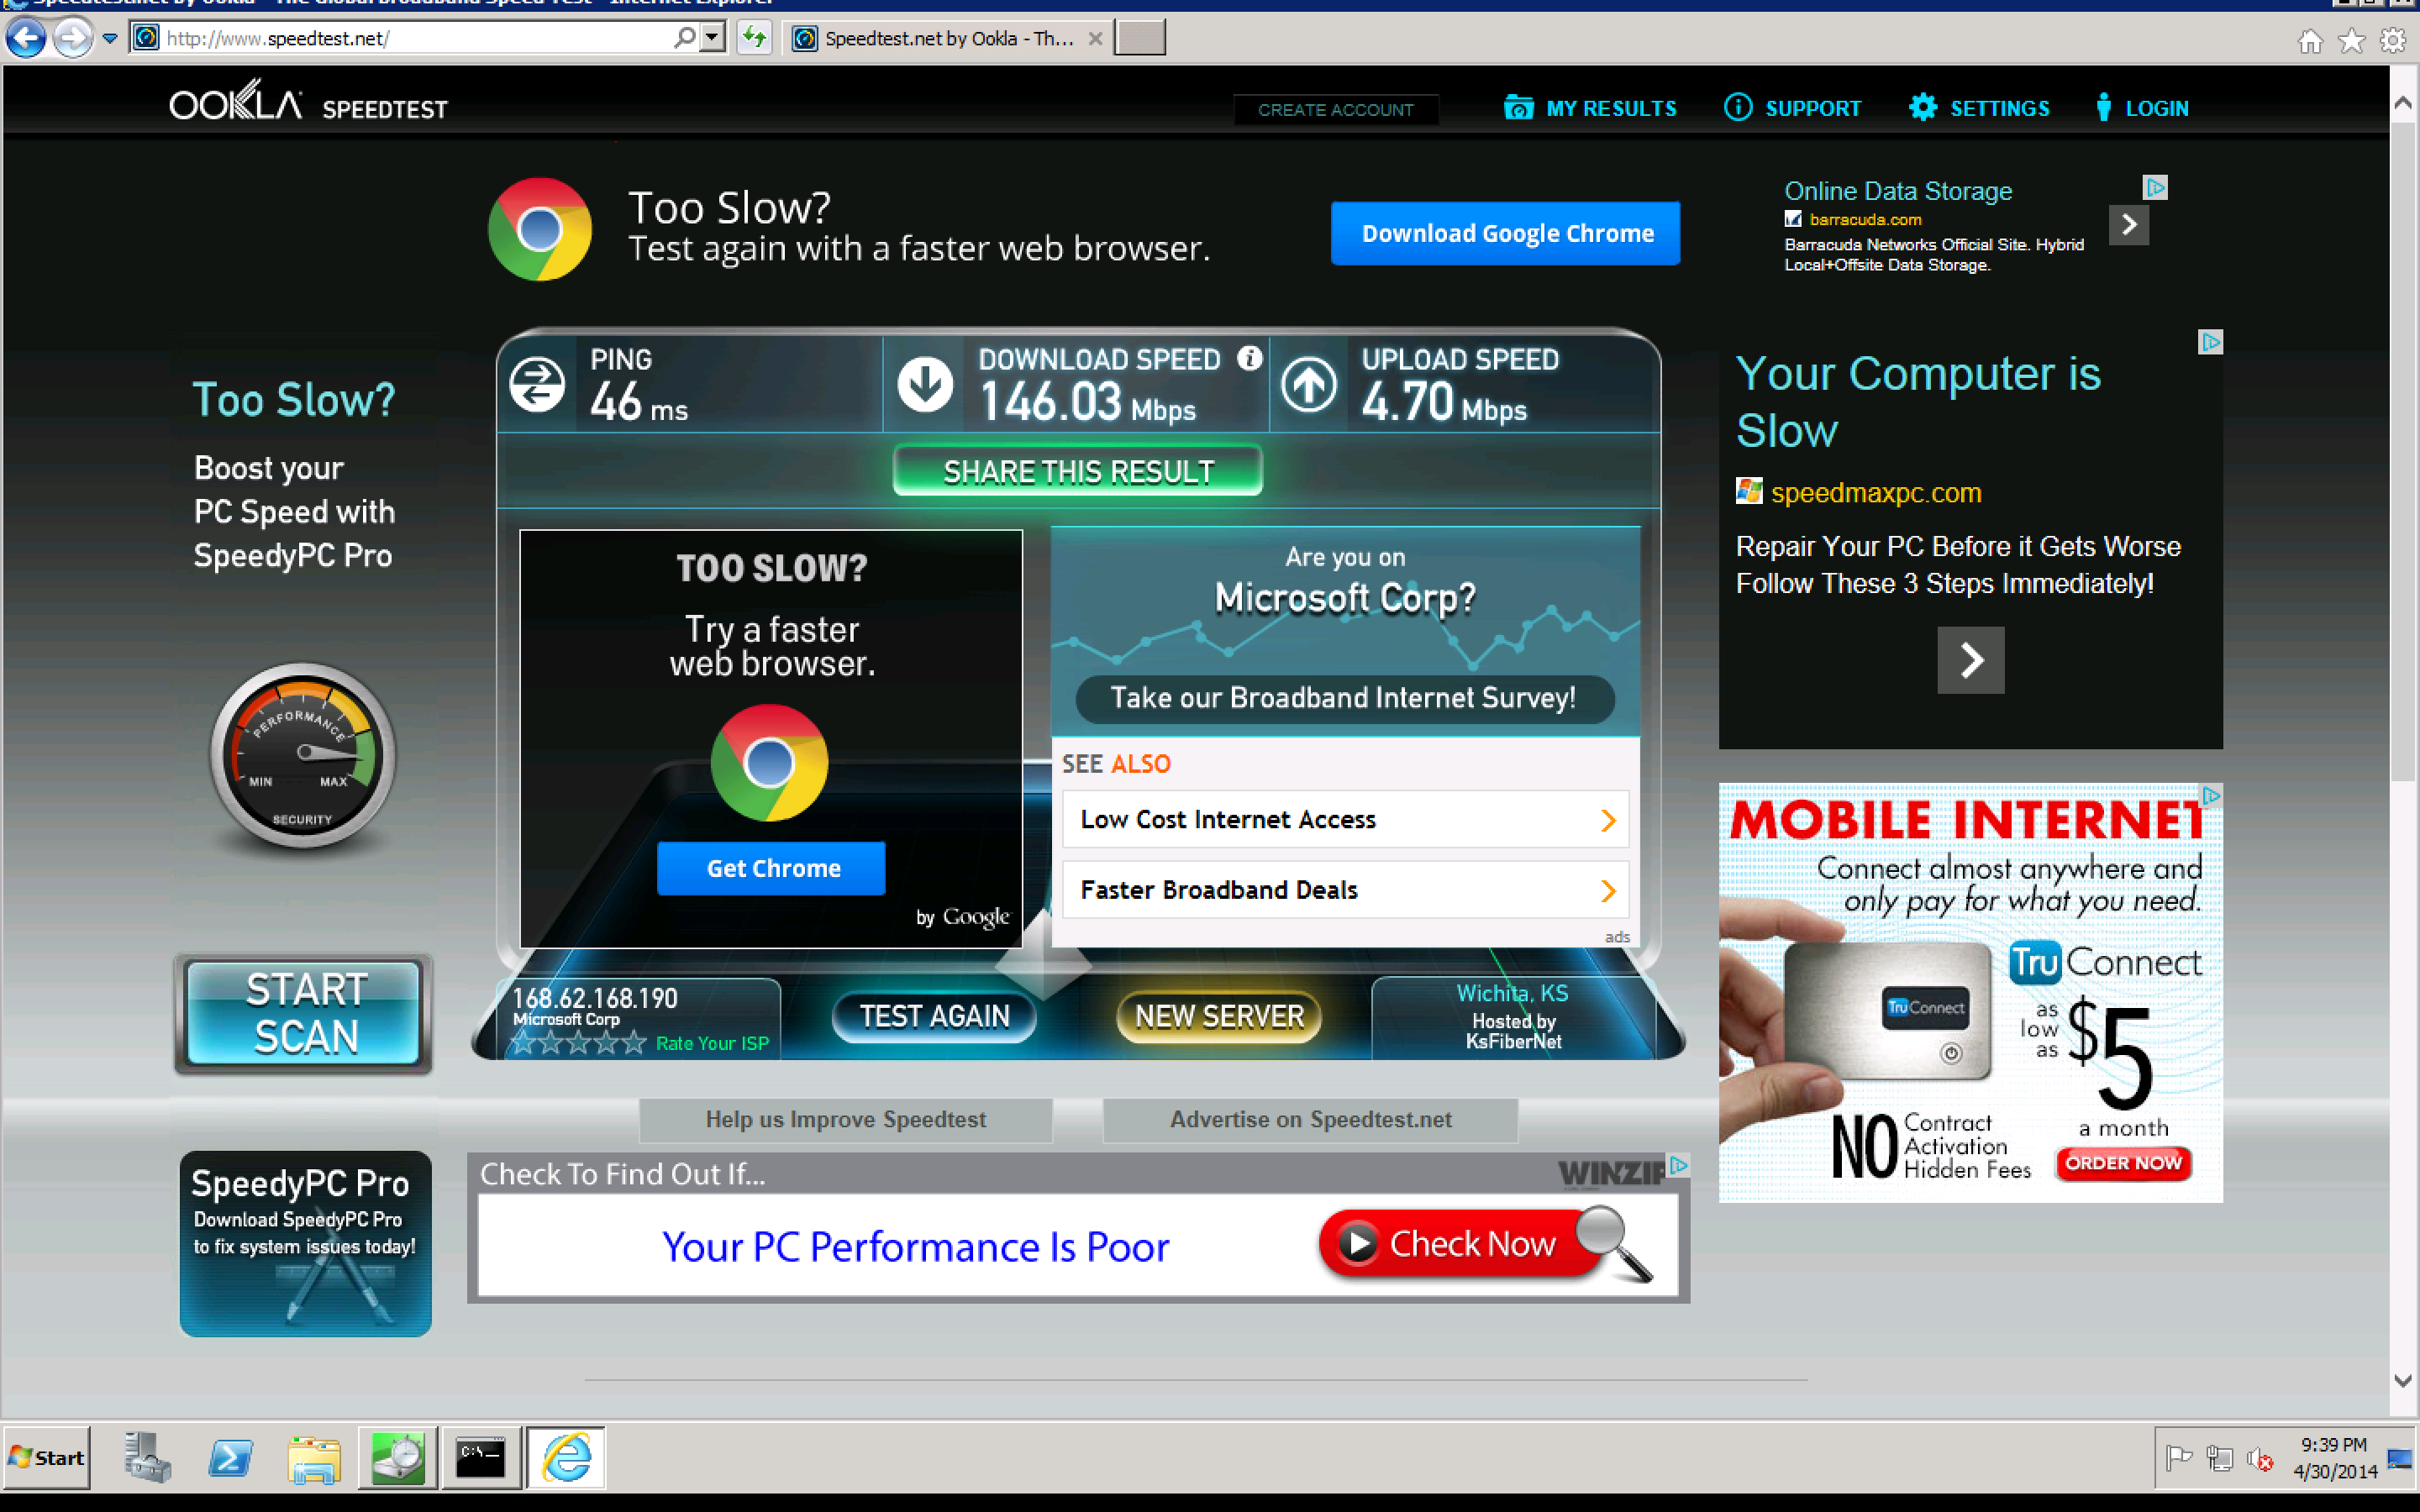
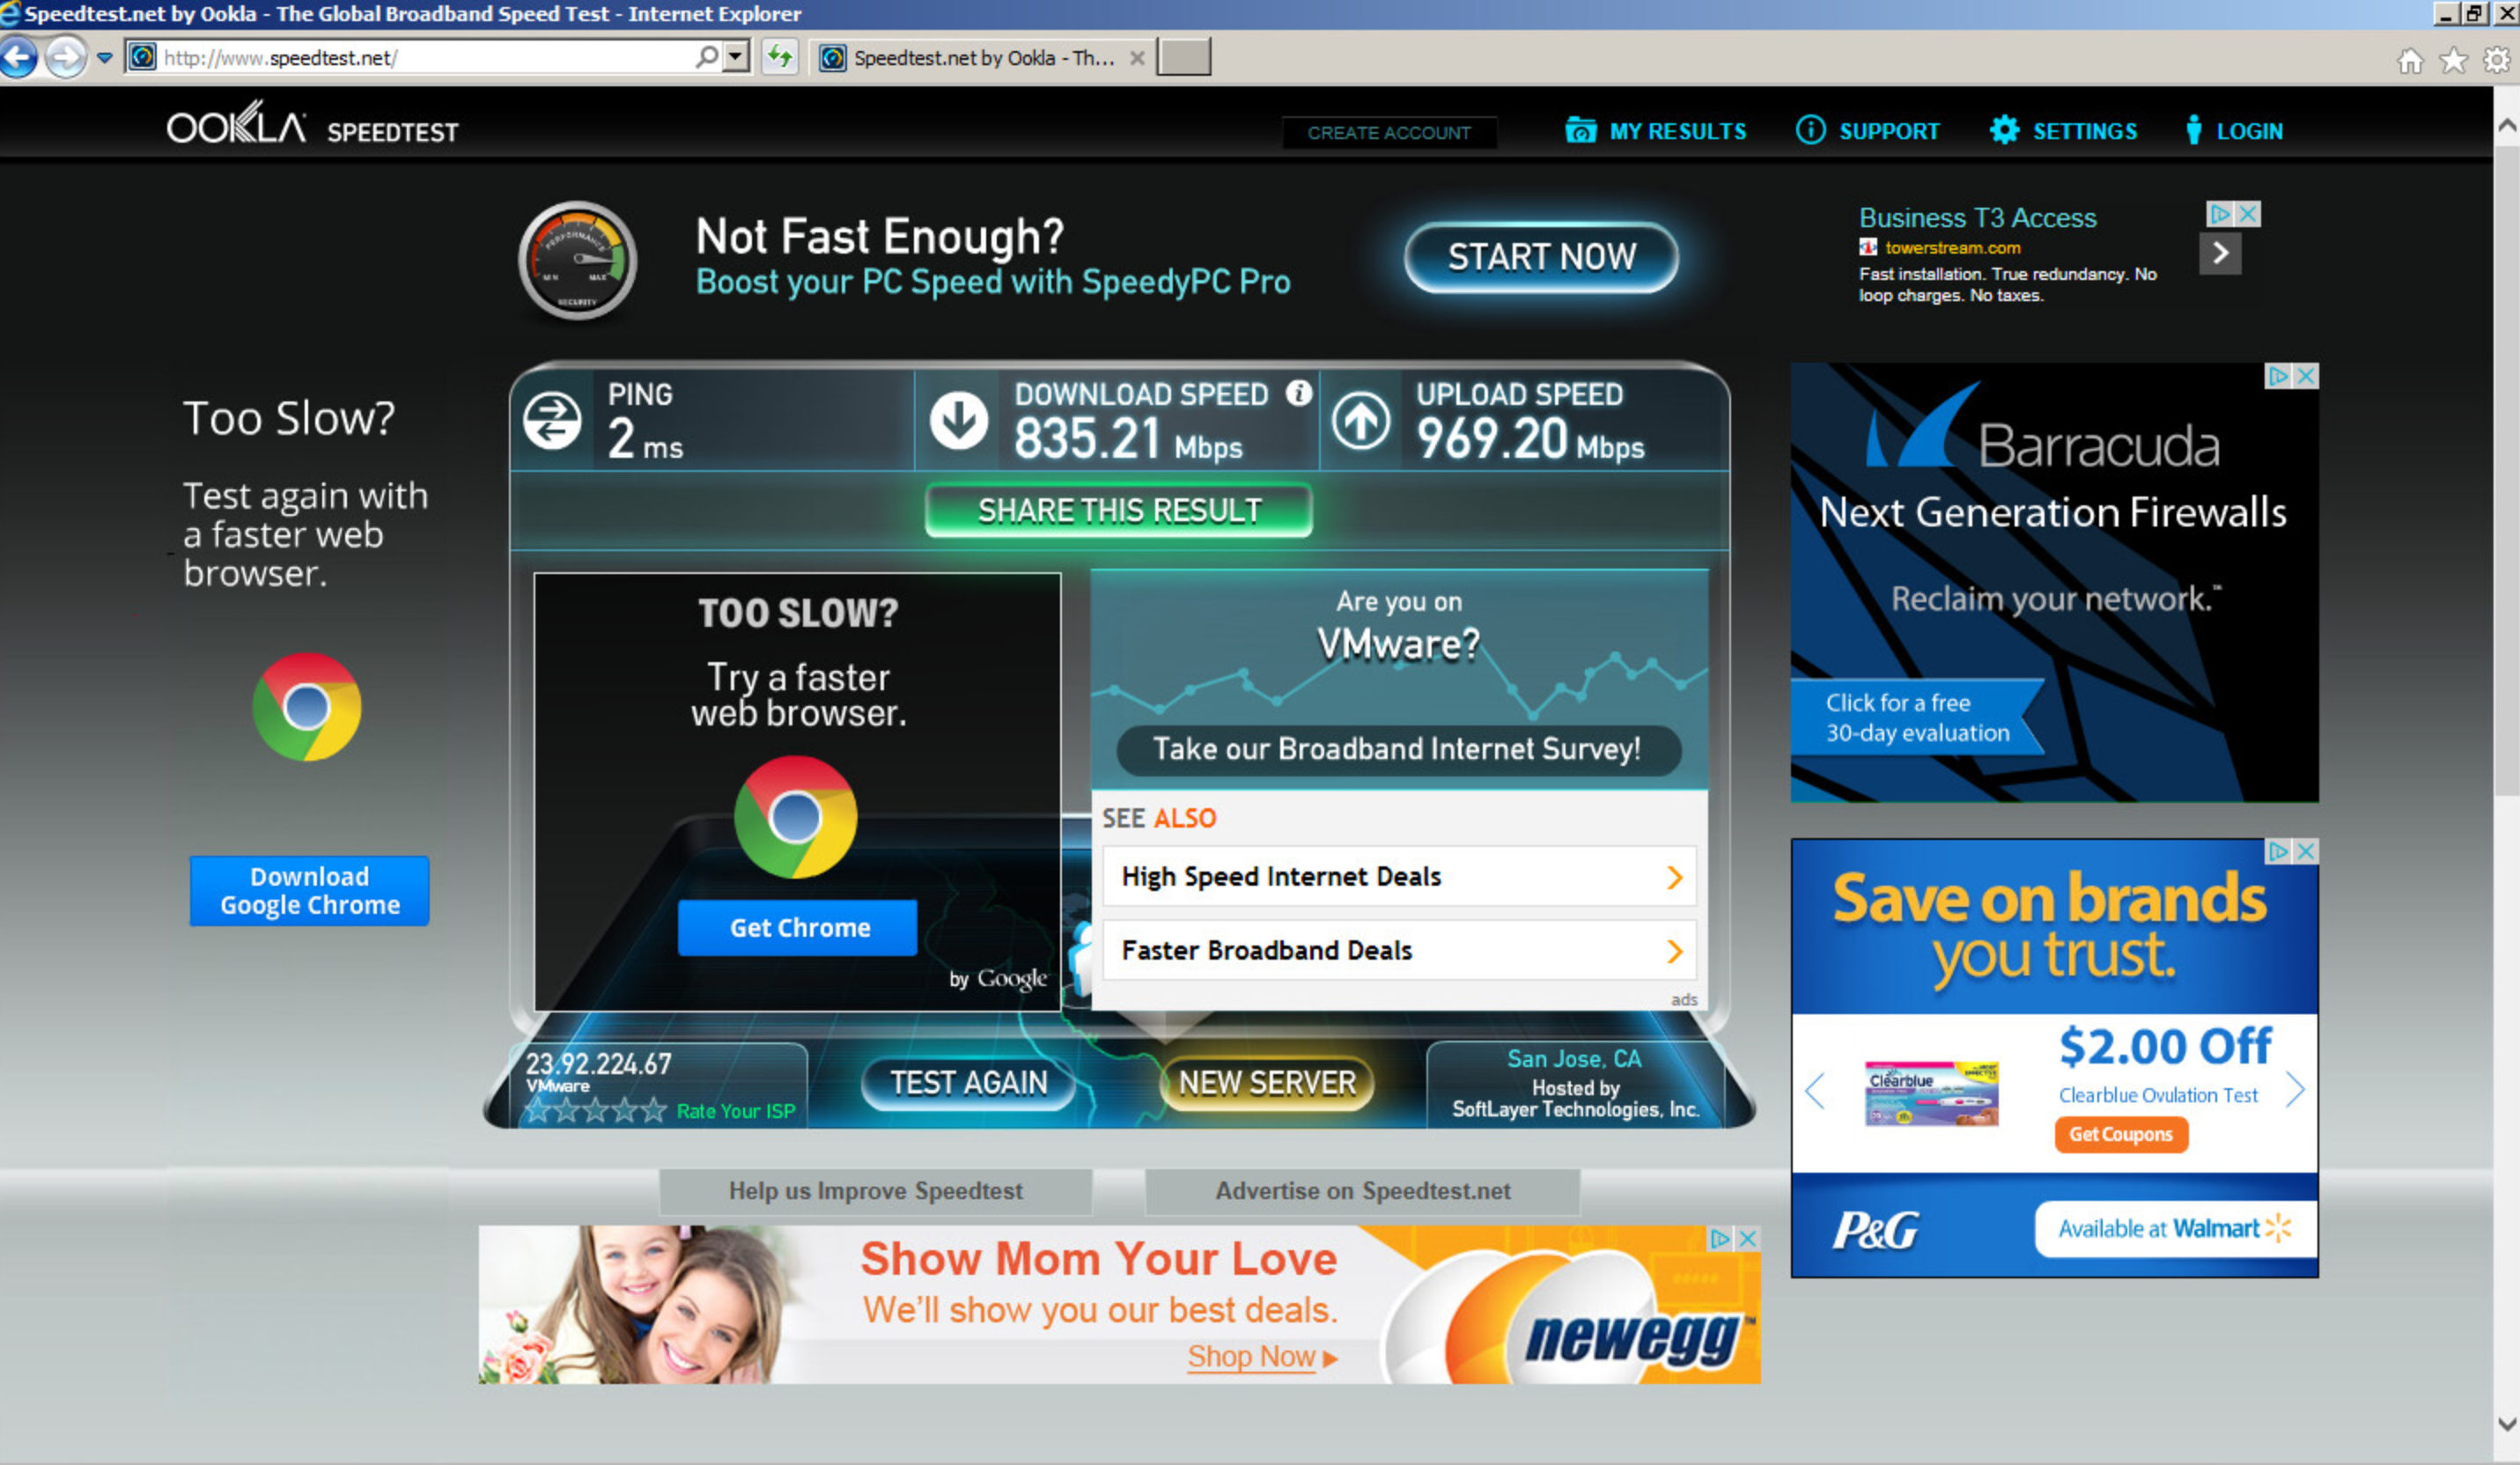
Ok, it’s official. We have all been moved to an alternate reality where the traditionally most expensive IT resources, network bandwidth and storage, have no become mere party favors to be handed out for free. How else can one explain nearly 150Mb/s of bandwidth on the “shared core A0” VM? The trend of greater than 100Mb/s bandwidth from the internet to the VM continues. There is a break from the overall pattern though. Microsoft is clearly throttling the egress bandwidth in a big way with our VM achieving “only” a paltry 4.7Mb/s upstream (just 3 T1 lines!) and latency is also up at 46ms. In my opinion Microsoft doesn’t want you hosting servers, or building your Social Media Startup Business, on the free A0 VMs. That said, you really could as 4.7Mb/s upstream and 46ms is nothing to sneeze at for small servers!
Crystal DiskMark 3.0.3 Results
I mentioned up top that the Azure default auto-configuration was interesting. The BGINFO desktop shot tells the tale here. By default, Azure allocated a 115GB drive C and a 19GB drive D to our VM. That’s a fairly large chunk of storage for a small VM and, combined with other recent Microsoft storage news, it might just be possible that Microsoft has found a way to produce hard drives from thin air. Either way more storage is good, so I’ll take it! Performance, of course, matters as well. CrystalDiskMark ran like a charm once again, but delivered some very strange results:
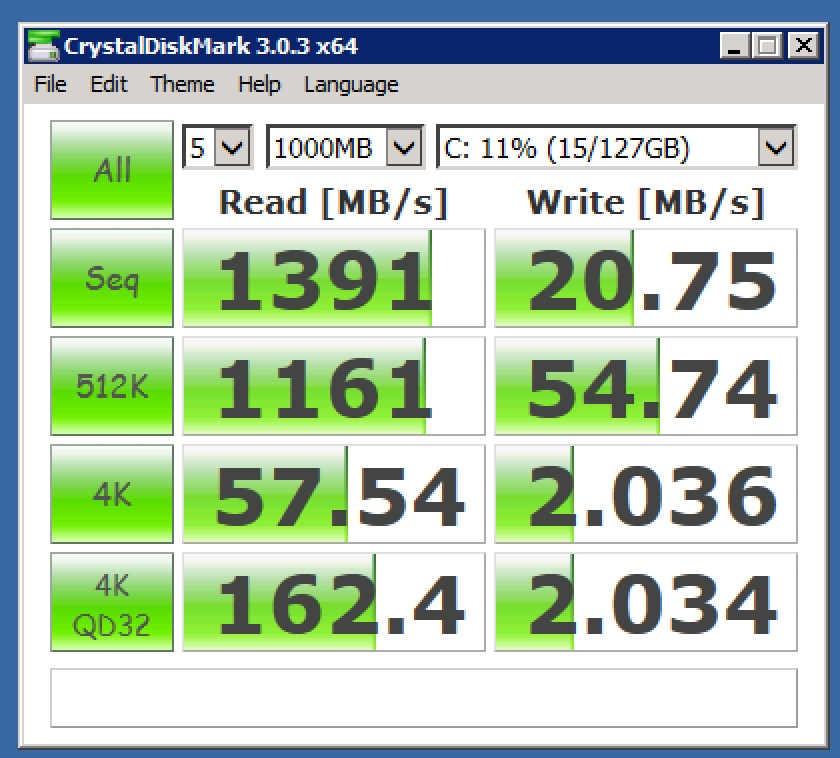
What the heck is going on in that magical brew that Azure uses as a storage backend? Once again, a very interesting, but surprisingly uneven result. We have AWS EBS level write performance, but combined with best in class read performance that easily exceeds even the great performance we saw from the vCHS SSD accelerated storage tier. It’s an interesting enough result that a table is in order!
| Test Category | vCHS SSD Accelerated | EBS Standard | Azure Standard |
| Sequential Read | 410.9 | 101.8 | 1391 |
| Sequential Write | 393.8 | 23.13 | 20.75 |
| 512K Random Read | 345.6 | 95.96 | 1161 |
| 512K Random Write | 299 | 21.54 | 54.74 |
| 4K Random Read | 16.48 | 7.36 | 57.54 |
| 4K Random Write | 8.808 | 2.853 | 2.036 |
| 4K Random Read, Queue Depth 32 | 93.57 | 33.7 | 162.4 |
| 4K Random Write, Queue Depth 32 | 58.94 | 8.046 | 2.034 |
So what can we infer from these results? It’s honestly hard to say. Azure is clearly the read king. There must be massive cache somewhere and I suspect that the Azure BLOB store is backing the block storage presentation to VMs through some cache accelerated gateway. Unfortunately the write performance really suffers. Probably writes aren’t being cached.
In my opinion vCHS still really shines here for two reasons. First is that vCHS is the write performance king, but in addition, the vCHS results are balanced. The read vs write imbalance of Azure bugs me a bit, but admittedly for many architectures it would be a non-issue and the huge IOPs you can get, ostensibly for “free”, would offset the poor write performance and the uneven overall delivery.
Incidentally, here is the performance result from that mysterious 19GB “scratch drive” assigned at D:
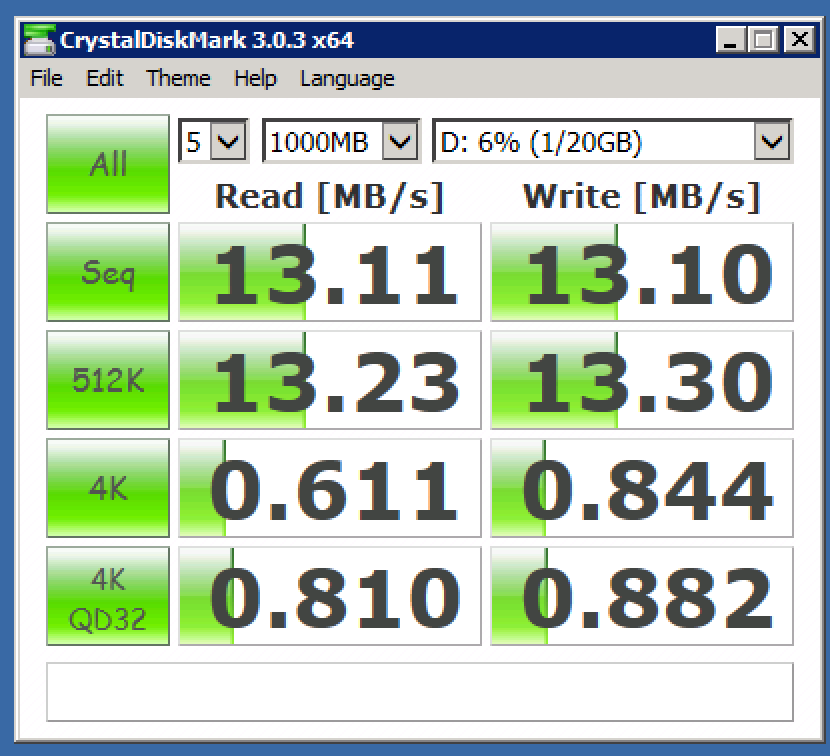
Clearly an entirely different performance characteristic. At first I thought this scratch drive might be local instance storage, similar to AWS, but given these performance results that doesn’t appear to be the case (unless it’s standard disks subscribed by multiple tenants). Either way, given this performance, and the extremely generous C drive, I’m not sure what I’d use this scratch space for.
SiSoft Sandra Lite Results
SiSoft Sandra was configured as per the last round of tests and an “Overall Score” was measured. First the visual confirmation:

And more importantly the detailed results:
SiSoftware Sandra
Display
Connection : Local Computer
Processor Arithmetic
Analysing...
Aggregated Score : 2.41GOPS
Result ID : AMD Opteron(tm) Processor 4171 HE (2.1GHz, 512kB L2, 5MB L3)
Speed : 2095MHz
Capacity : 1Unit(s)
Power : 510.00W
Finished Successfully : Yes
Processor Multi-Media
Analysing...
Aggregated Score : 3.95MPix/s
Result ID : AMD Opteron(tm) Processor 4171 HE (2.1GHz, 512kB L2, 5MB L3)
Speed : 2095MHz
Capacity : 1Unit(s)
Power : 510.00W
Finished Successfully : Yes
Cryptography
Analysing...
Aggregated Score : 0.035GB/s
Result ID : AMD Opteron(tm) Processor 4171 HE (2.1GHz, 512kB L2, 5MB L3)
Speed : 2095MHz
Capacity : 1Unit(s)
Power : 510.00W
Finished Successfully : Yes
.NET Arithmetic
Analysing...
Aggregated Score : 1.42GOPS
Result ID : AMD Opteron(tm) Processor 4171 HE (2.1GHz, 512kB L2, 5MB L3)
Speed : 2095MHz
Capacity : 1Unit(s)
Power : 510.00W
Finished Successfully : Yes
.NET Multi-Media
Analysing...
Aggregated Score : 0.73MPix/s
Result ID : AMD Opteron(tm) Processor 4171 HE (2.1GHz, 512kB L2, 5MB L3)
Speed : 2095MHz
Capacity : 1Unit(s)
Power : 510.00W
Finished Successfully : Yes
Memory Bandwidth
Analysing...
Aggregated Score : 2.107GB/s
Result ID : Microsoft Hyper-V virtual VGA; 768MB None
Capacity : 768MB
Finished Successfully : Yes
Cache & Memory Latency
Analysing...
Aggregated Score : 172.6ns
Result ID : Microsoft Hyper-V virtual VGA; 768MB None
Capacity : 768MB
Finished Successfully : Yes
File System Bandwidth
Analysing...
Aggregated Score : 659.089MB/s
Result ID : Virtual HD (136.4GB, ATA)
Speed : 5400rpm
Capacity : 136.37GB
Finished Successfully : Yes
File System I/O
Analysing...
Error (5206) : \\.\C:\ : Write error. Drive access error.
Aggregated Score : 685.0IOPS
Result ID : Virtual HD (136.4GB, ATA)
Speed : 800Mbps
Capacity : 136367MB
Finished Successfully : Yes
GP (GPU/CPU/APU) Processing
Analysing...
Error (339) : No devices found. : GP(GPU) call failed. Try another interface (e.g. OpenCL/ComputeShader/CUDA/etc.) or update video drivers.
Finished Successfully : No
Video Shader Compute
Analysing...
Error (335) : DirectX 11 Device(s) : RDPDD Chained DD : Display call failed. Try another interface or update video drivers.
Error (335) : OpenGL Device(s) : RDPDD Chained DD : Display call failed. Try another interface or update video drivers.
Finished Successfully : No
Processor Multi-Media
Analysing...
Aggregated Score : 3.97MPix/s
Result ID : AMD Opteron(tm) Processor 4171 HE (2.1GHz, 512kB L2, 5MB L3)
Speed : 2095MHz
Capacity : 1Unit(s)
Power : 510.00W
Finished Successfully : Yes
GP (GPU/CPU/APU) Financial Analysis
Analysing...
Error (339) : No devices found. : Floating-Point (Normal/Single Precision) : GP(GPU) call failed. Try another interface (e.g. OpenCL/ComputeShader/CUDA/etc.) or update video drivers.
Finished Successfully : No
Processor Financial Analysis
Analysing...
Aggregated Score : 0.28kOPT/s
Result ID : AMD Opteron(tm) Processor 4171 HE (2.1GHz, 512kB L2, 5MB L3)
Speed : 2095MHz
Capacity : 1Unit(s)
Power : 510.00W
Finished Successfully : Yes
GP (GPU/CPU/APU) Bandwidth
Analysing...
Error (339) : No devices found. : GP(GPU) call failed. Try another interface (e.g. OpenCL/ComputeShader/CUDA/etc.) or update video drivers.
Finished Successfully : No
Video Memory Bandwidth
Analysing...
Error (334) : DirectX 11 Device(s) : RDPDD Chained DD : Shader call failed. Try another interface (e.g. OpenGL) or update video drivers.
Finished Successfully : No
Memory Bandwidth
Analysing...
Aggregated Score : 2.242GB/s
Result ID : Microsoft Hyper-V virtual VGA; 768MB None
Capacity : 768MB
Finished Successfully : Yes
Overall Score Aggregated Score : 0.33kPT
Results Interpretation : Higher Scores mean Better Performance.
Decimal Numeral System (base 10) : 1GPT = 1000MPT, 1MPT = 1000kPT, 1kPT = 1000PT, etc.
Result ID : Microsoft Virtual Machine (AMD Opteron Processor 4171 HE; Microsoft Hyper-V virtual VGA; 768MB None; Virtual HD; AMD Opteron Processor 4171 HE)
Finished Successfully : Yes
And the results are in! Azure splits the difference between vCHS (.83kPT) and EC2 (.22kPT) here, but comes closer to the low bar set by t1.micro, at .33kPT. Still, this is not bad considering the ominous warning of the “shared core” status of the A0 VM and the AMD architecture. This is superior performance to the t1.micro with more RAM, better storage perf, and similar bandwidth (downstream anyway).
With Sandra in the can, let’s have a look at DaCapo…
DaCapo 9.12 Java Benchmark Suite Results
Last entry I provided some background on what DaCapo is and why I think it’s important, so let’s just jump right to the results. Of course the same test mix was used for consistency:
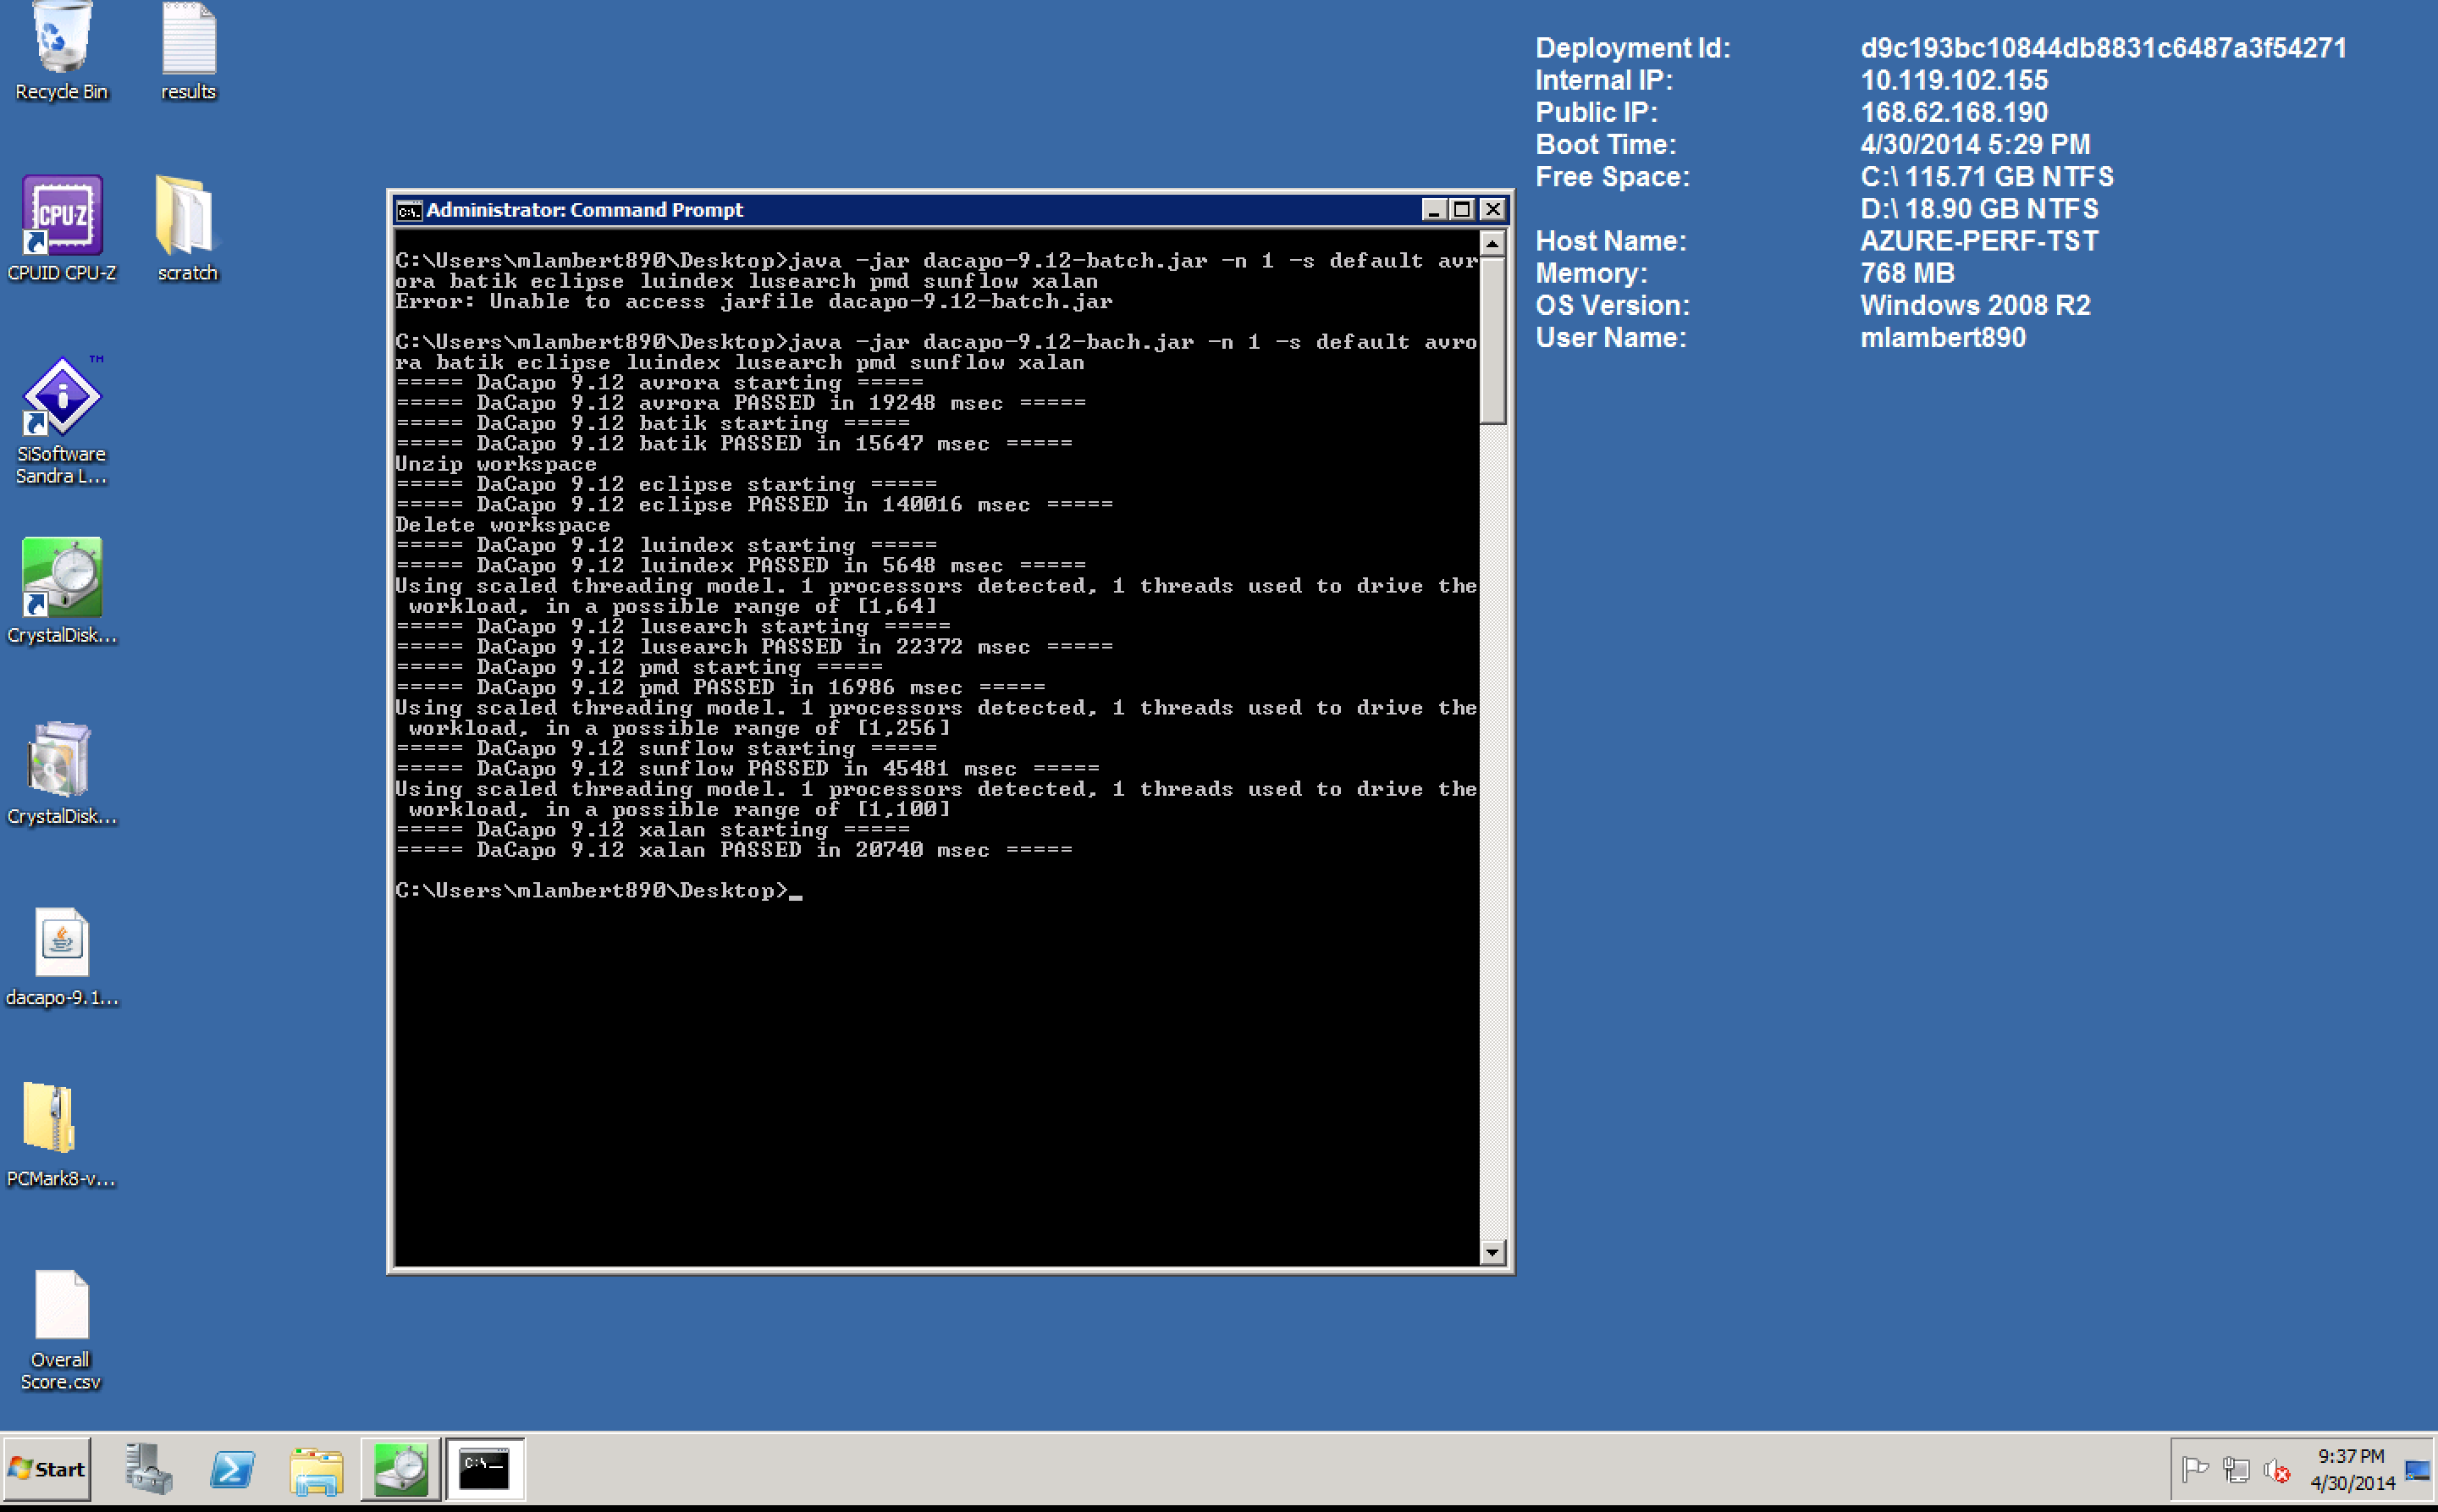
Azure weights in at 286138 msec, once again splitting the difference between vCHS (142320 msec) and EC2 (629369 msec), but this time closer to the vCHS performance bar (although only 50% of it). So how much did the test cost? Again, interesting results. It completed much quicker than AWS, but the pricing was very similar:
| Azure | |
| Support | N/C |
| Storage | N/C |
| Compute | 0.001478549 |
| Network | 0.001310833 |
| TOTAL COST | 0.002789383 |
On Azure the DaCapo test cost us $.002789 to run. As a refresher, EC2 cost $.0028. Coincidence? I don’t believe in them, do you? Microsoft is clearly targeting EC2 in a real way, delivering better performance at a higher cost per unit resulting in a lower cost for the actual workload. This shows you how complex the cloud TCO picture can get! For workloads that have a finite task, Azure would be superior. It can complete the work faster, and for the given workload will do it cheaper. For steady state type work, where the server is just up indefinitely, the cheaper cost per performance unit of EC2 would be more economically attractive. Once again, there isn’t really a direct comparison against vCHS. Like Amazon, Microsoft includes a free support offering, but this is just basic phone support. VMware is charging what appears to be an order of magnitude more, but Premier level support is included in that number. As VMware evolves the platform it will be interesting to see if they move downmarket to tackle this super low cost commodity tier. For now, the target is clearly enterprise.
Conclusions
Overall I have to say that from a pure performance perspective, Azure is beating AWS at the commodity tier. Neither one match vCHS at really anything, but to be fair that was a commodity sized VM carved out of a premium performance resource block and so is not really directly comparable.
