
Introduction
With public cloud infrastructure as a service adoption rate accelerating even in the traditional enterprise state, comparative performance measurements between providers is becoming increasingly important to architects and developers. Ultimately the smart money is on a multi-cloud strategy with smart orchestration and an SLA/service-centric view of your organization, but knowing what you’re buying is an important part of making economic based decisions around which platform to leverage at a given time or in a given scenario.
Test Setup and Overview
So with this background in mind, I decided to take a deeper look at the current market leader in IaaS, AWS EC2, and compare it against the newest player in the mix, VMware’s vCloud Hybrid Service. I am fortunate to have access to vCHS for testing purposes and Amazon makes a free tier available which, while limited, is perfectly useful for testing the low end of the spectrum. While not perfect, testing at this level is valuable as long as care is taken to make the test as equivalent as possible.
With my concept in mind and credentials in hand, I set off down the roads of the two competing platforms to document not only the performance, but the overall experience. For my testing, I settled on the following mix:
- OS: Windows 2008 R2 – I wanted to use Windows for the testing since it is relevant to such a large number of enterprise customers
- Benchmark Suite:
- PCMark 8 v2 – PCMark ended up a bust crashing on both VMs (detail below)
- CrystalDiskMark 3.0.3
- SiSoft Sandra Lite 2014 R2 20.28
- DaCapo 9.12 Java Suite
- System Info: CPU-Z – to take a deeper look at what the platform is providing for compute, I settled on my old favorite CPU-Z
- Virtual Hardware: this one is interesting because the two platforms take a dramatically different approach here. Amazon provides hardware configuration for you in a variety of “instance sizes”. For free, the biggest instance you can get is a “T1.micro”. With vCHS VMware sells you blocks of capacity in either multi-tenant (“Virtual Private Cloud” – 5Ghz and 20GB RAM base to allocate to VMs) or dedicated (“Dedicated Cloud” – 30Ghz and 120GB RAM to allocate to “Virtual Datacenters” from which capacity is then allocated to VMs). Based on the limits of the AWS free tier, the T1.micro instance’s hardware mix set the baseline for the test:
- CPU: 1 vCPU at 1.8Ghz (Sandybridge era) This is a very tricky baseline to set unfortunately since the whole point of cloud is that hardware detail is abstracted out. Compounding this is that with vCHS, as mentioned above, you carve vCPUs out of a Ghz pool. If you only provision a single CPU from your pool, you have lots of potential for massive burst performance which will obviously only ramp down as additional vCPUs are provisioned into VMs. Still, with access to a vCHS Dedicated Cloud for testing I was able to carve up a very small single VM Virtual Datacenter of 2Ghz for this test. Definite points for flexibility to vCHS here although not a negative per say for AWS since the models are so dramatically different.
- RAM: the T1.micro gives you 618MB of RAM which makes Windows 2008 R2 quite an interesting science project (it does work though). For vCHS I gave the VM 640MB RAM
- Storage: for AWS the T1.micro free tier instance running Windows 2008 R2 comes with a 30GB EBS standard disk. This is network attached block storage using Amazons proprietary scheme for EBS and backed by RAID 1. For vCHS I gave the VM a 30GB VMDK on the SSD accelerated storage tier which is a tiered RAID protected storage model that should provide higher IOPs than EBS generally but does not allow for prescriptive IOPs assignment the way PIOPs does.
- Network: single standard 1Gb/s (in theory) virtual NIC for the instance and for the VM
Machine Creation
Creating the machines on either platform is a great “eureka” moment for any cloud skeptic. It is incredible how effortless it is to grab capacity with nothing more than a browser on either platform. I took some screen shots of the process, but first here are the results of the “VM creation time” test. Keep in mind that with AWS the “time to cloud” is instantaneous. What this means is that you click through a sign up process no different than any standard web service registration and then can immediately start launching instances. With vCHS it is a more enterprise centric approach for now that requires a purchase process. At this stage you cannot simply visit the website and be up and running in minutes. That said, once provisioned, the “time-to-VM” is quite comparable so this was what I measured:
Time to VM/Instance Results:
- vCHS Time to VM: 2:30
- EC2 Time to Instance: 3:30
vCHS scores a victory here! The time to bring the VM online was noticeably quicker. EC2 time to instance was variable over a few runs with 3 minutes 30 seconds being the best time. Two other creation attempts were actually a bit slower. OK those are the numbers, but how was the experience? I’ll let the screenshots tell the story here. First, AWS:
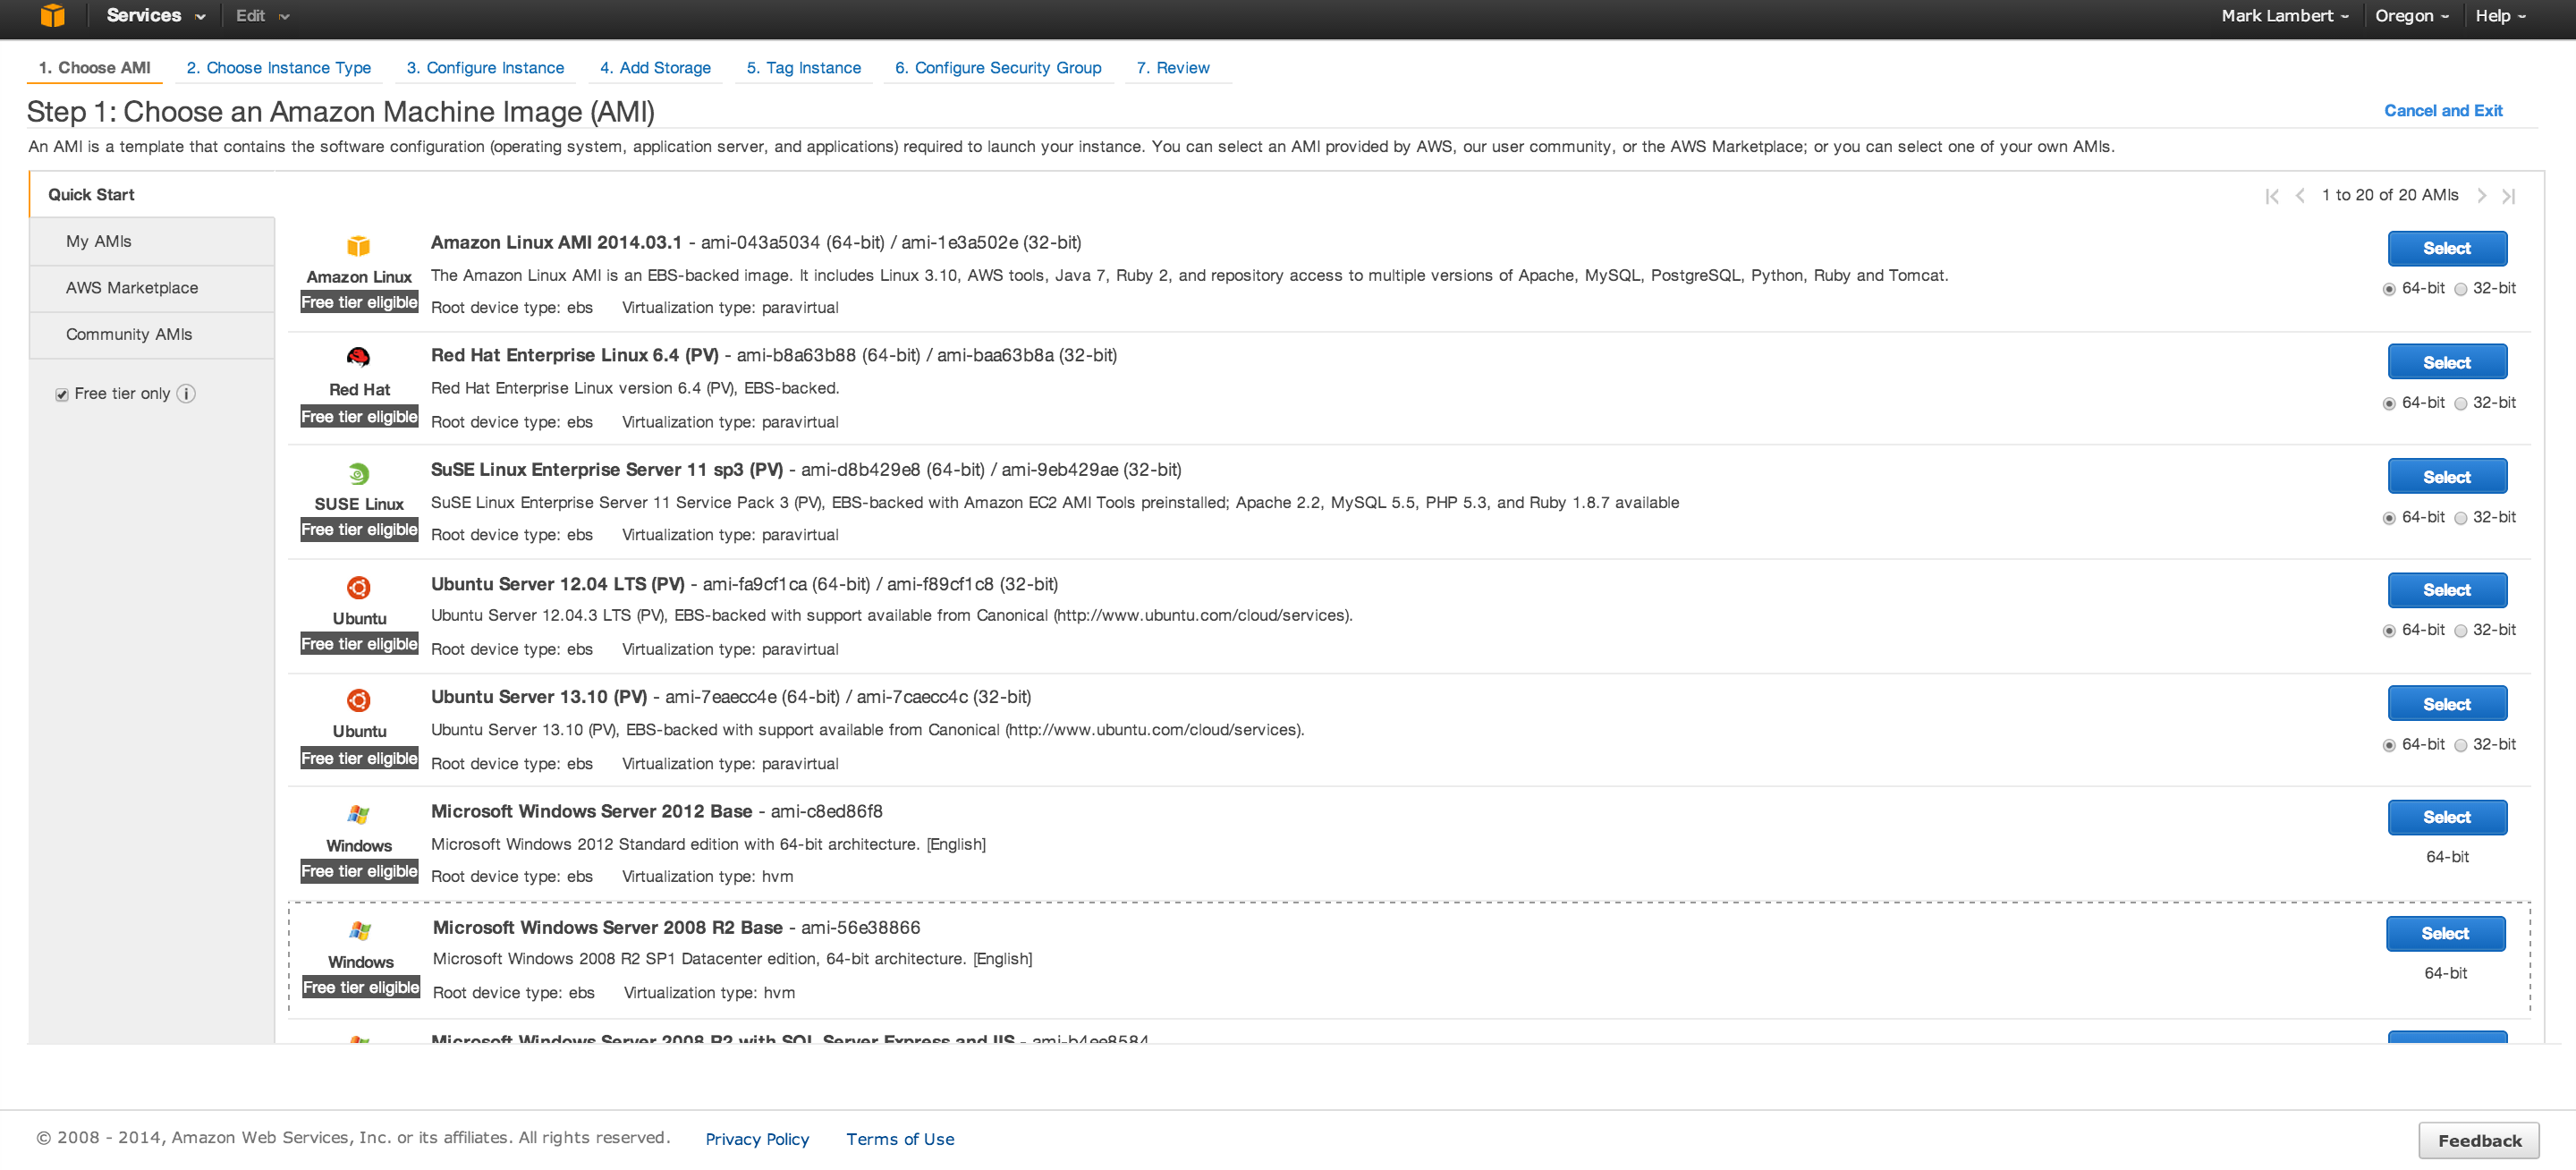
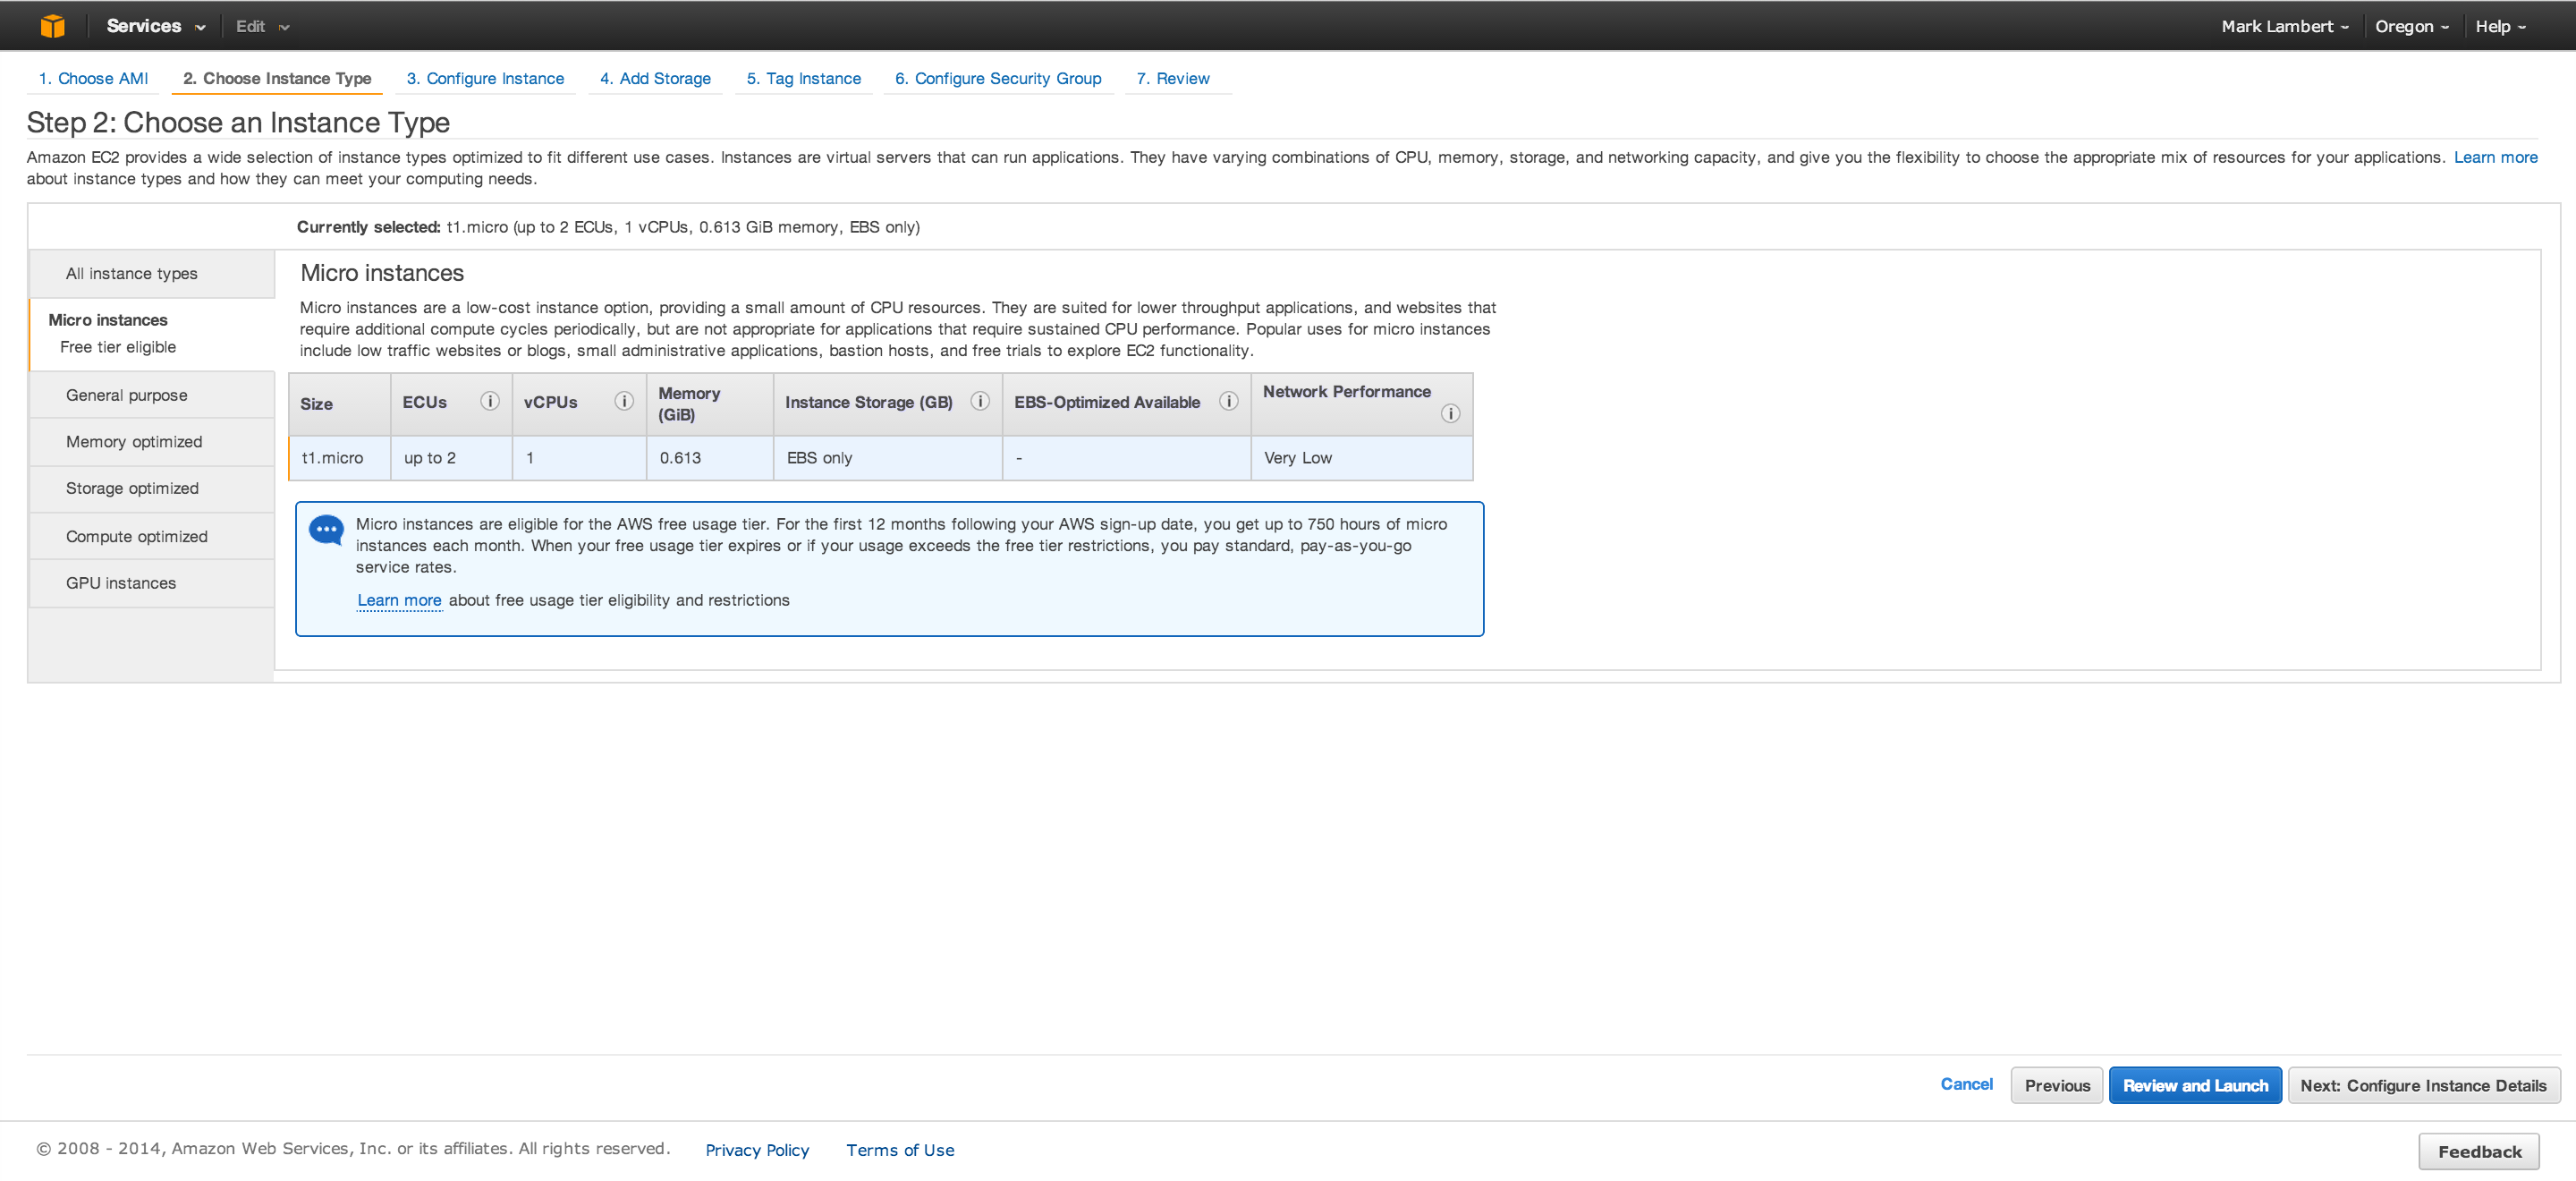

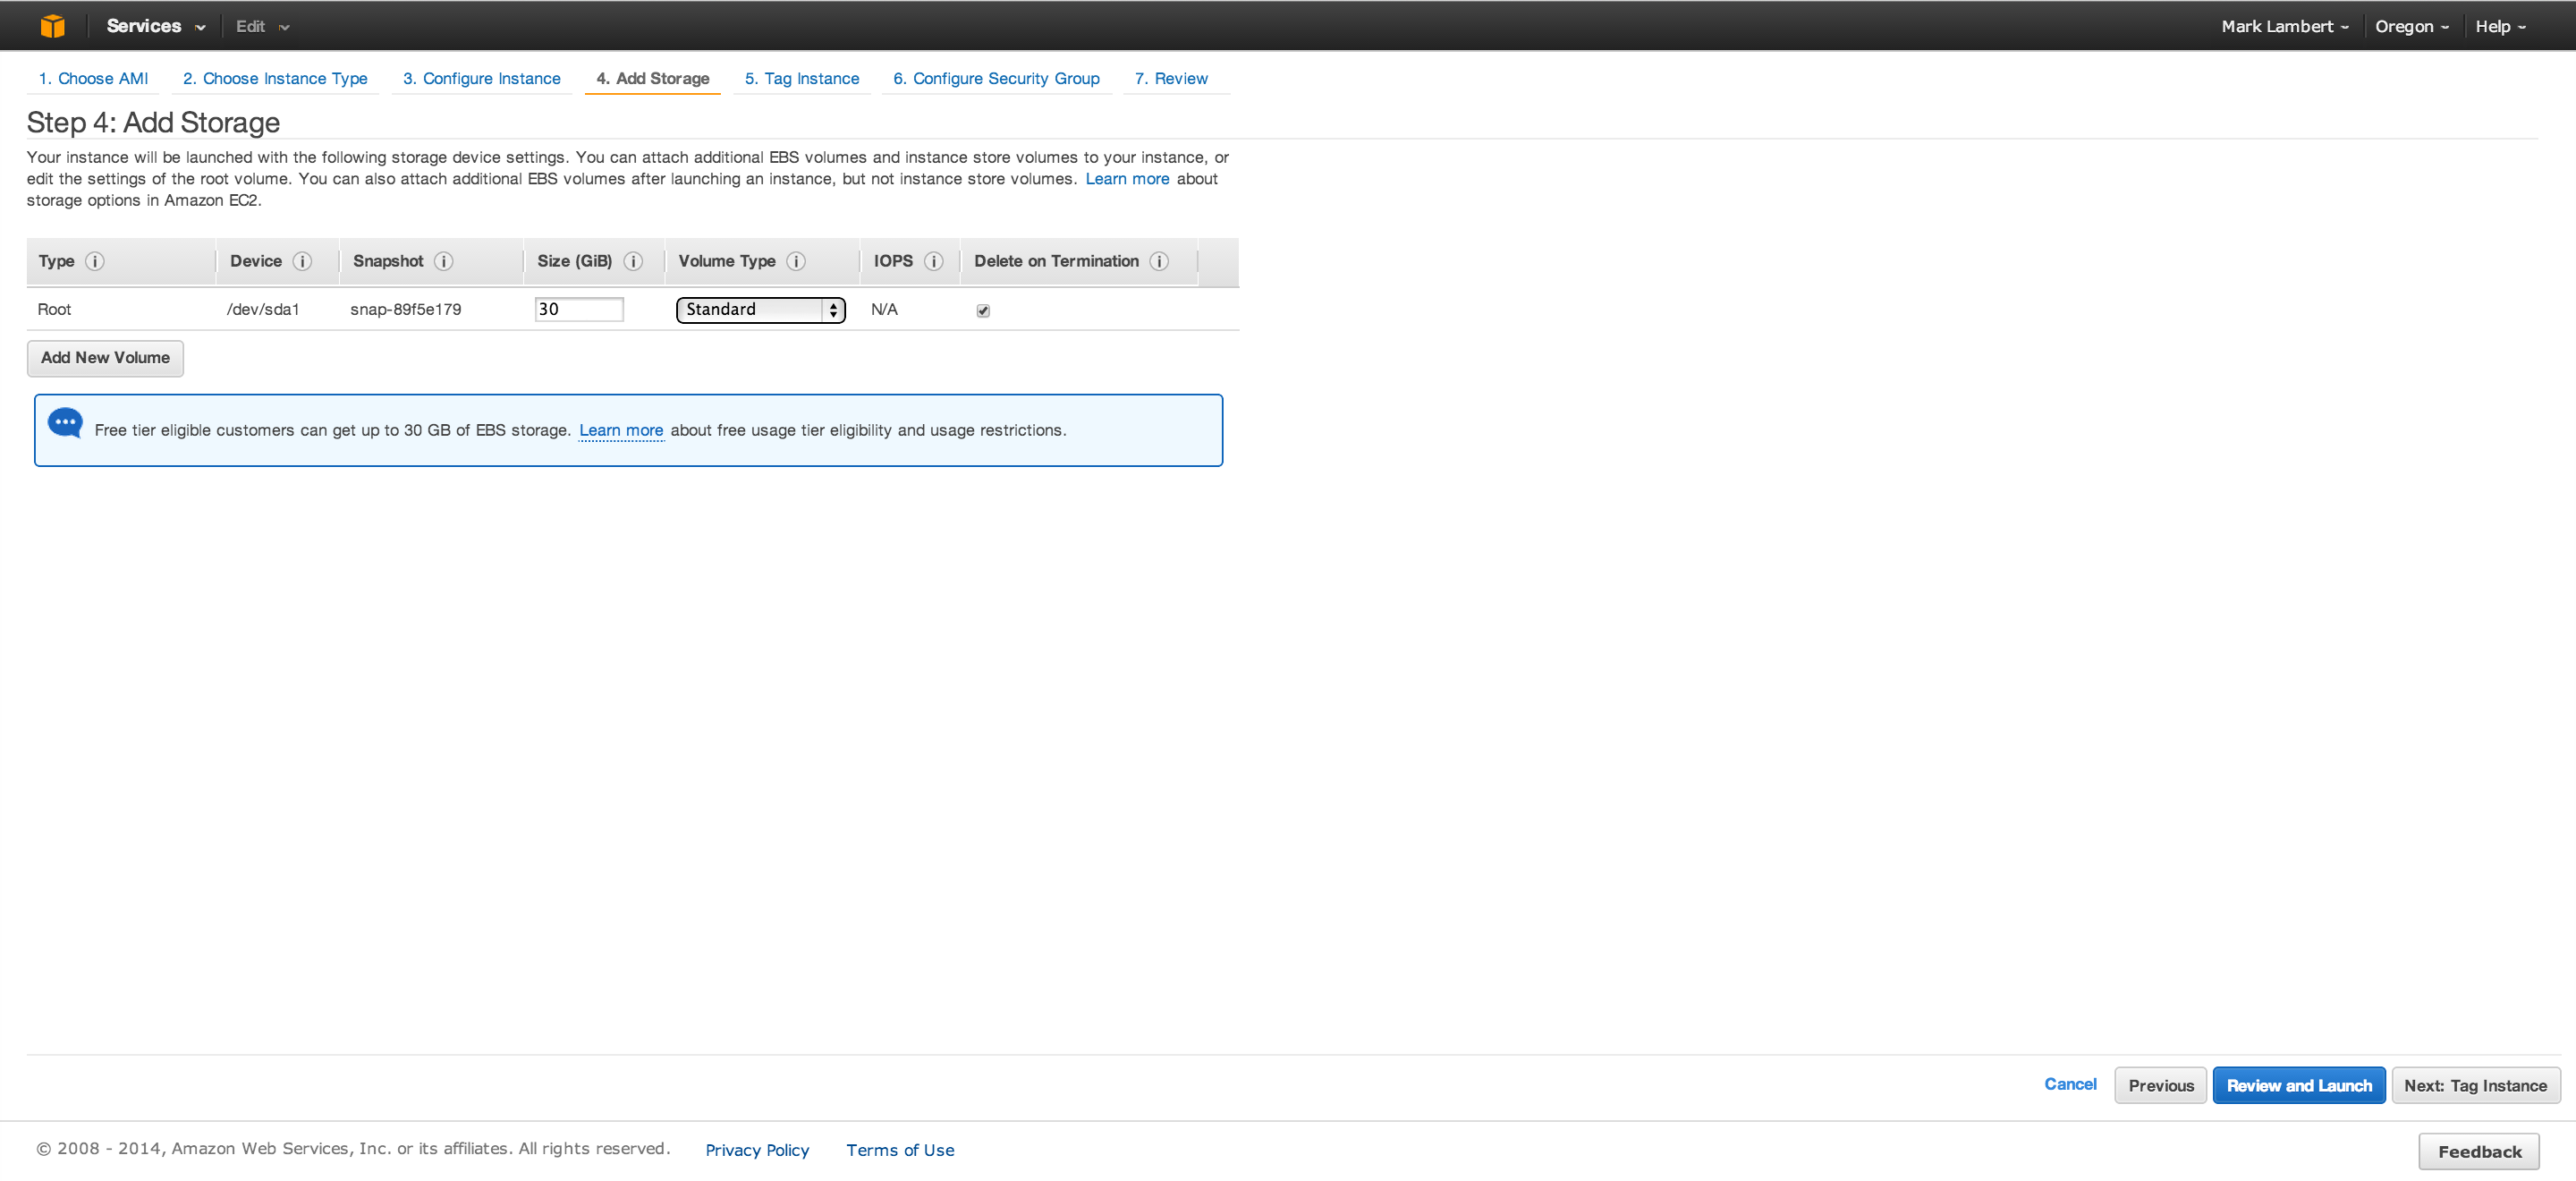
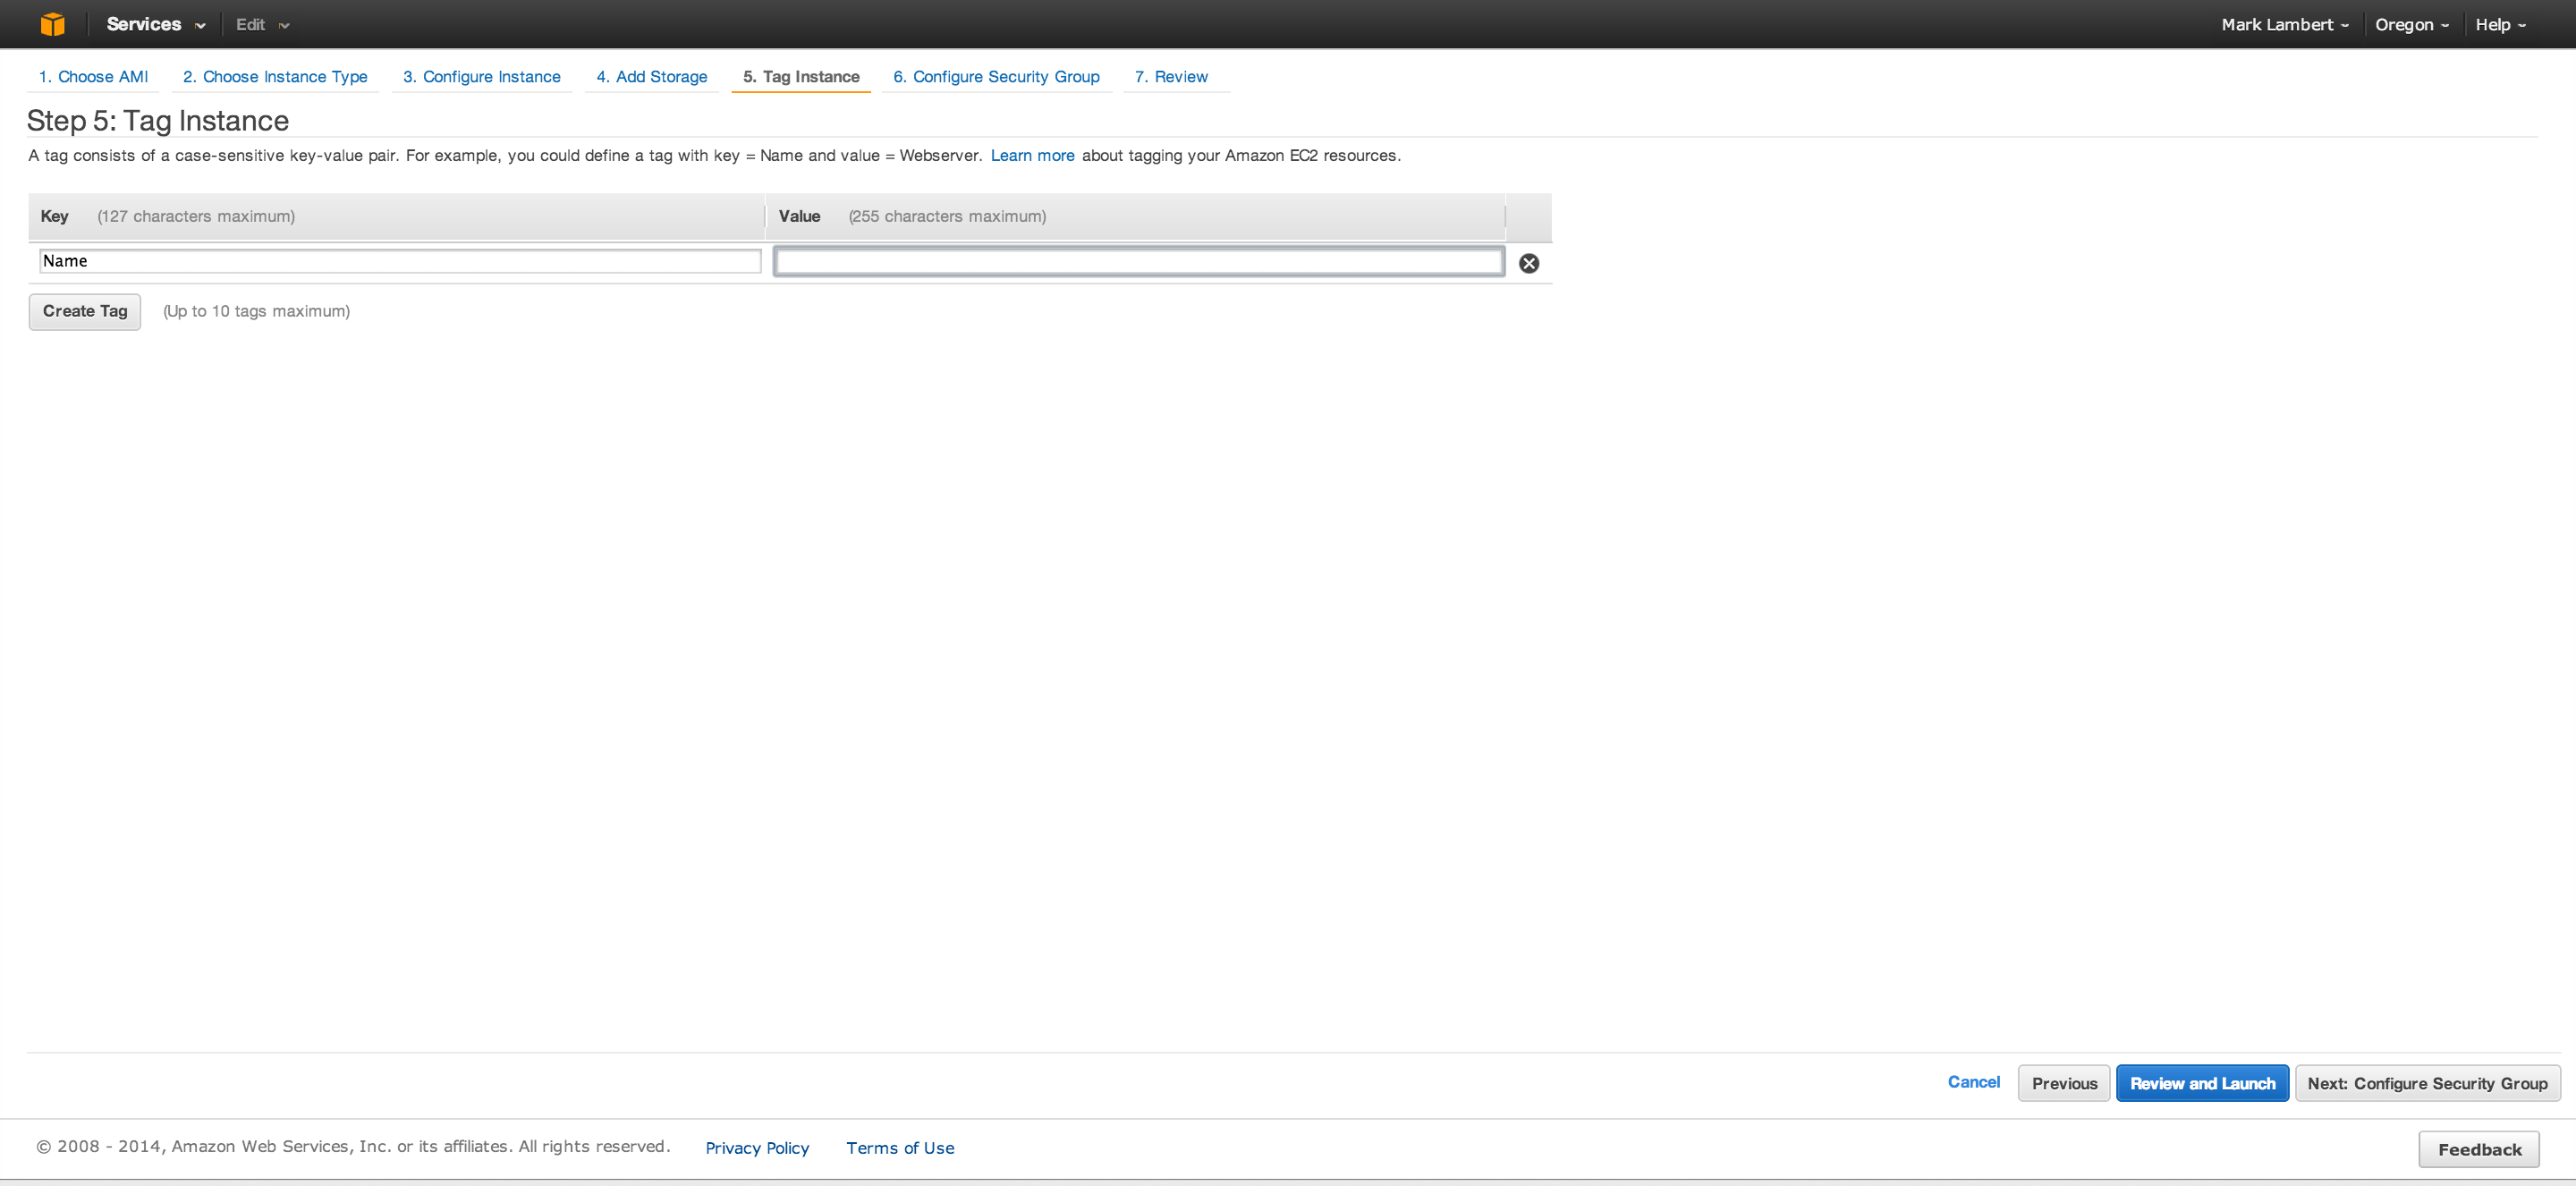
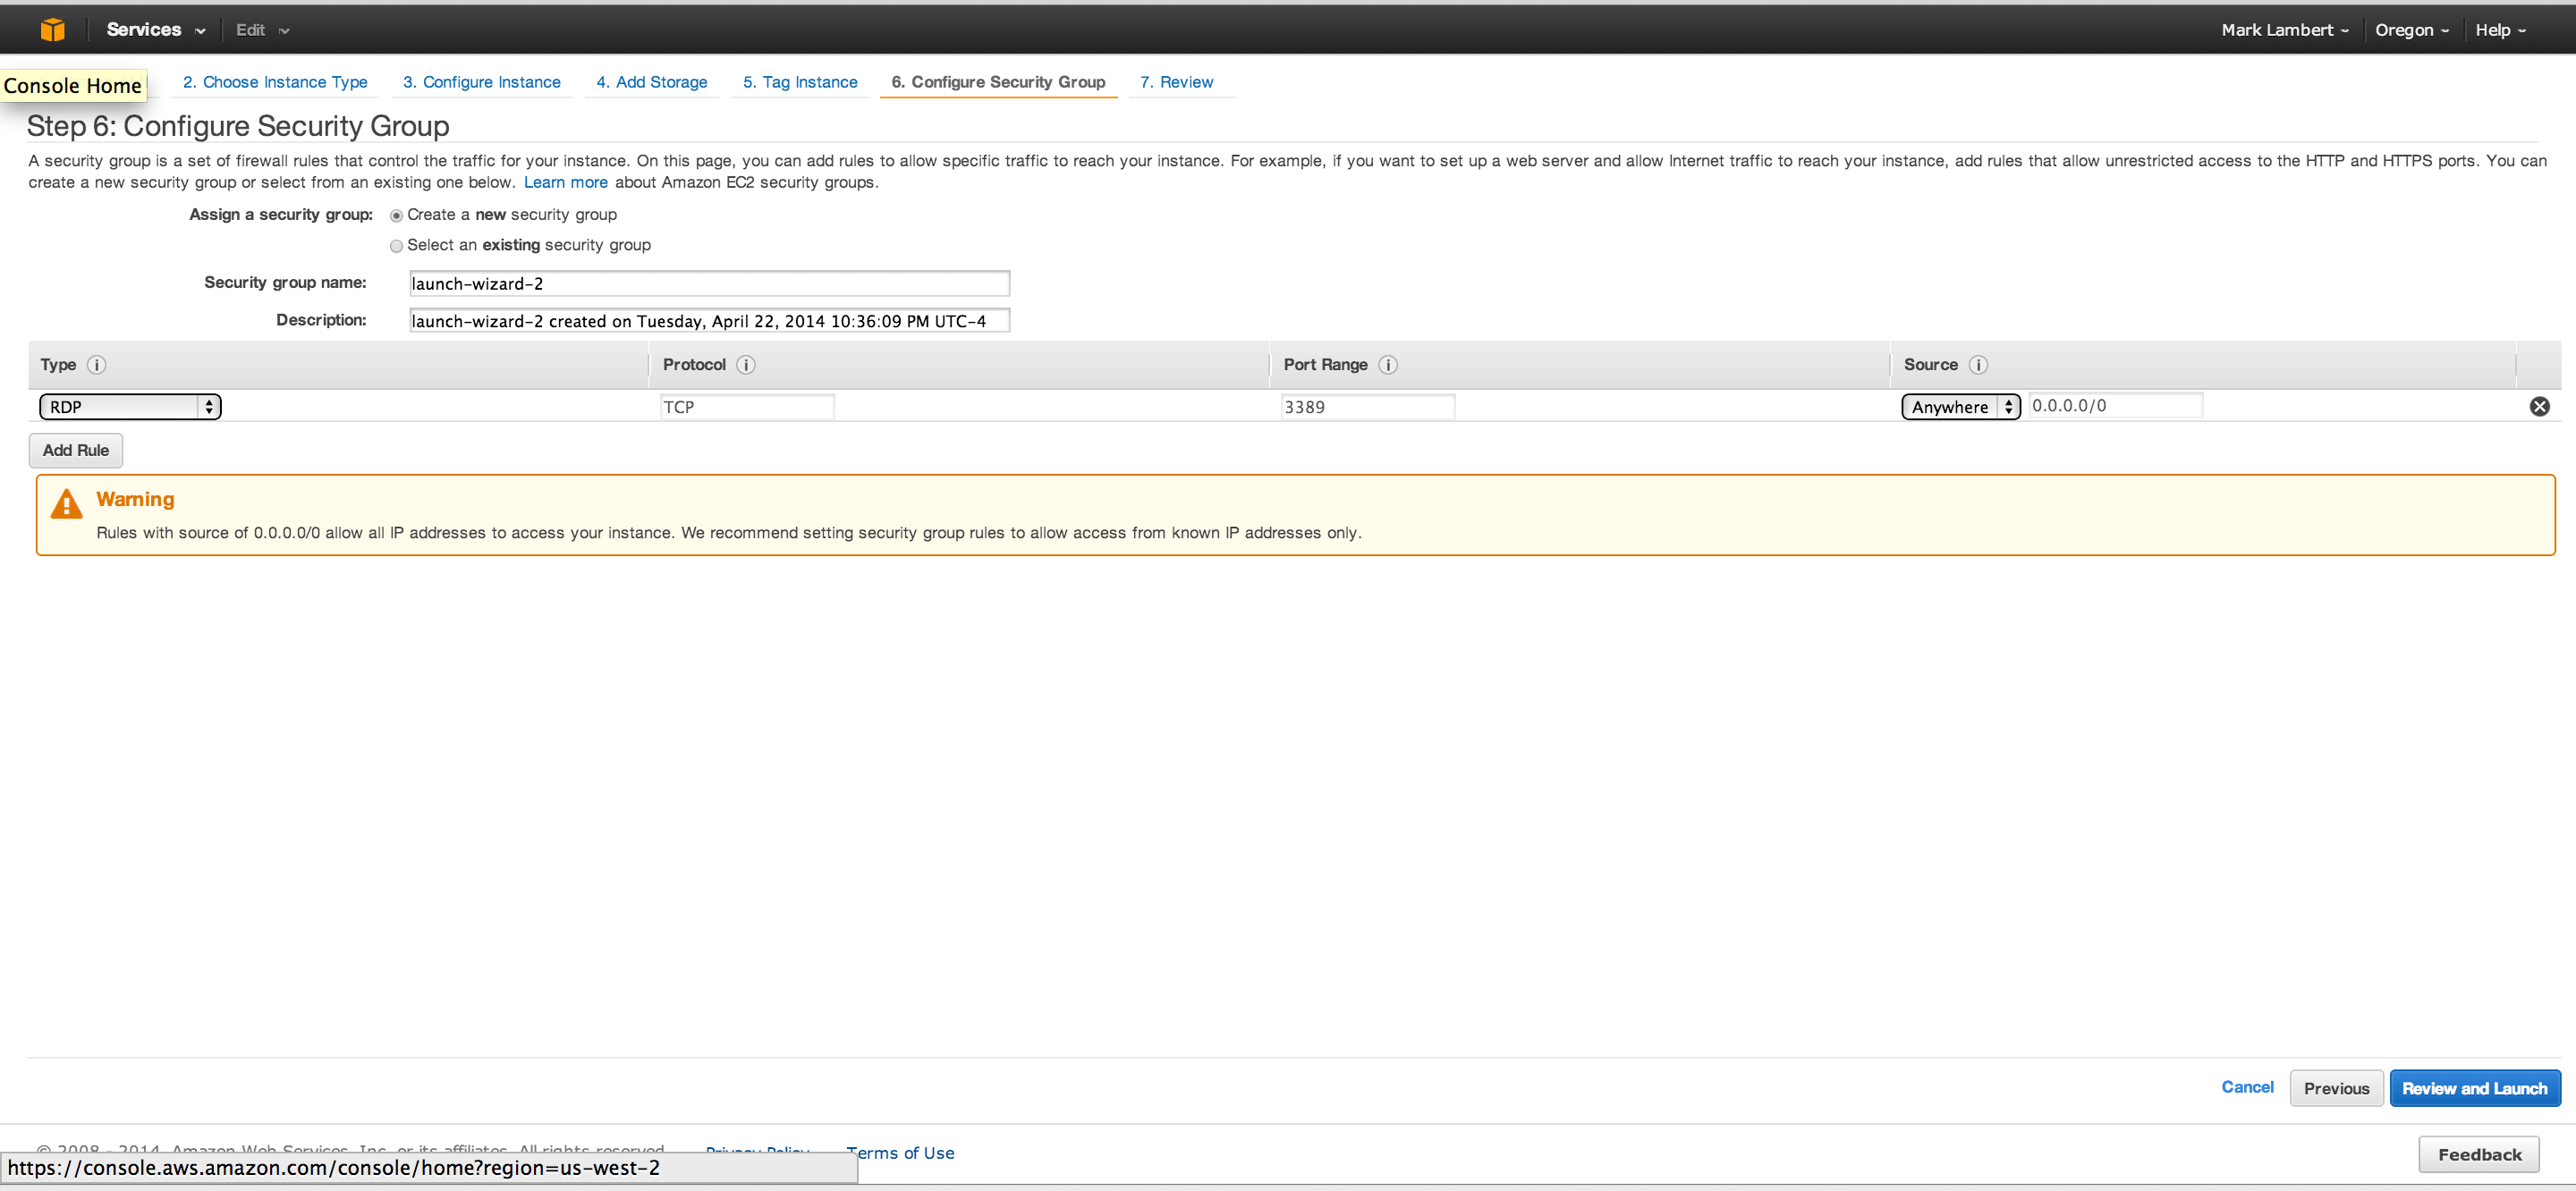
Very simple click through console experience! The first image shows the basic EC2 console view with 2 instances provisioned. The second image is the first step of the “Launch Instance” process presenting the standard EC2 catalog from which an AMI (OS gold master essentially) can be selected. Huge depth here. Next up is Step 2, the Instance Selection dialogue, where you choose the instance size. No choice is given since we selected “free tier” which only allows T1.micro. Step 3 allows us to configure instance provisioning details. Tons of powerful options here, all out of scope for this discussion. Step 4 we add storage. Again prescribed by our service tier. Step 5 we can apply some metadata and “tag” our instance. And finally in Step 6 we assign a Security Group (or create one) which is a hypervisor level firewall protecting the instance at the network level. So what is the process like with vCHS? Let’s take a look:


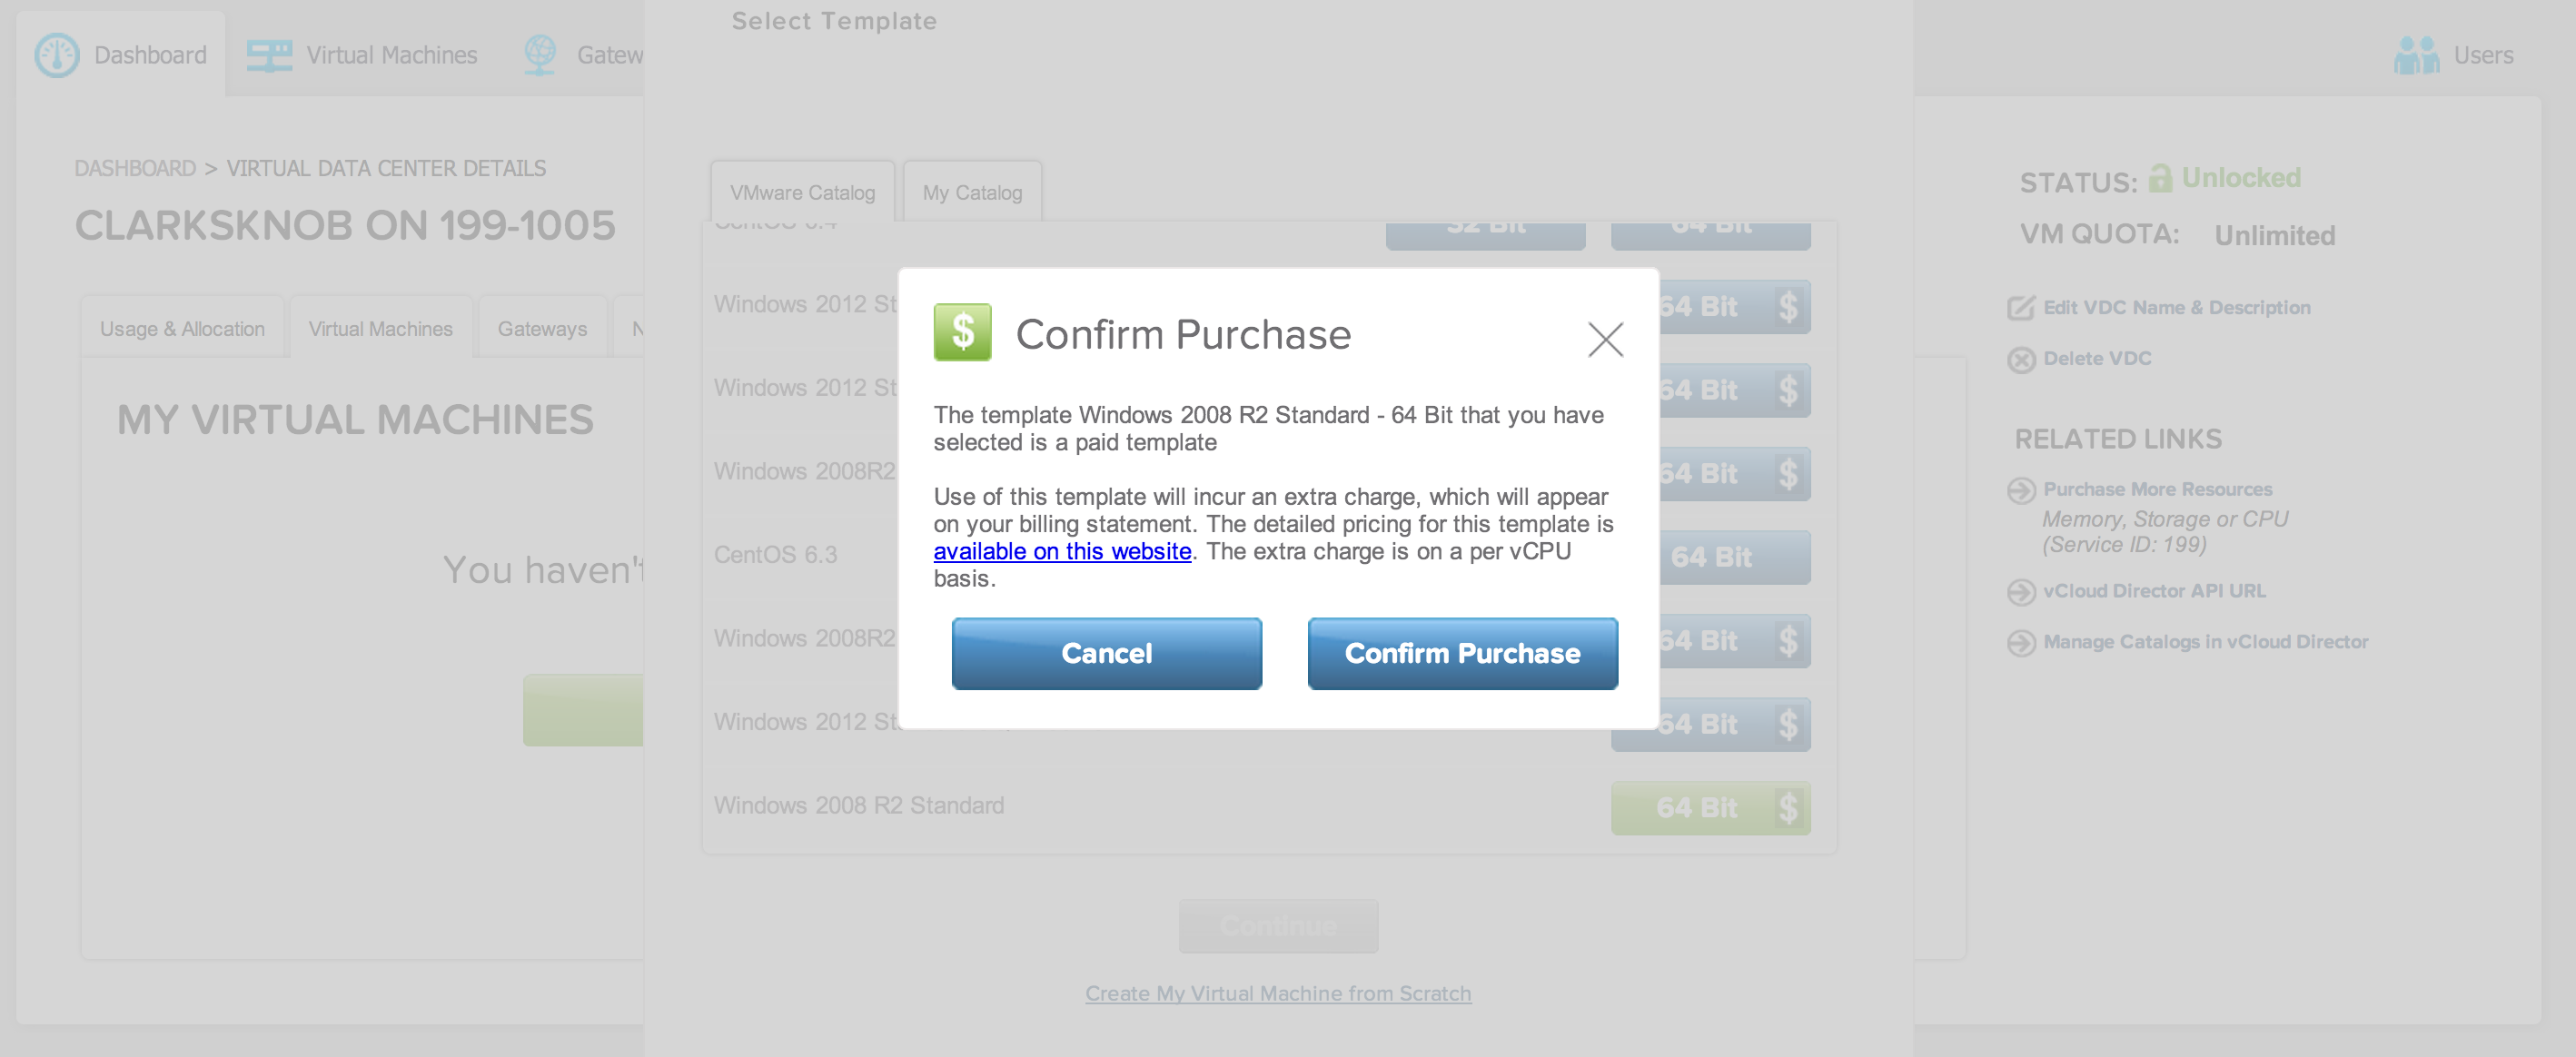

Fairly similar experience overall. The first 3 screenshots are quite different from anything in AWS as they cover allocating a block of capacity to a Virtual Datacenter. In this case I am reducing my allocation from 5Ghz down to 2Ghz to allow for the constrained test. Next up is the catalog view of vCHS following the click through from “Add a VM” to selecting Windows 2008 R2 standard. As we can see here this will be a cost item. Worth noting that AWS provides Windows on the free tier. Next we set our options for the virtual machine in one spot (compute, storage and RAM), as well as connect it to a network, and then click “Deploy the Virtual Machine” to create it. With vCHS, the networking and security configuration happens in a separate part of the UI and is a bit more aligned with what traditional vSphere administrators, or network administrators for that matter, might expect. Within the Network Configuration sections of the vCHS UI you can setup firewall and NAT rules (vs the subnet ACL or hypervisor level security group controls in EC2) at the virtual gateway as well as create up to 9 defined private subnets off of that gateway to which VMs can attach. In EC2 private IP space is allocated at the CIDR block level within a VPC and a Virtual Private Gateway, as well as a virtual router internal to the VPC, and a NAT that can be added during VPC creation, all operate fairly transparently. Overall I would say that vCHS networking is more flexible and definitely a more direct match to legacy skill sets whereas AWS networking is simpler for those who don’t really care that much about the details of networking and just want to get their services communicating (read as developers).
So What’s Under the Hood?
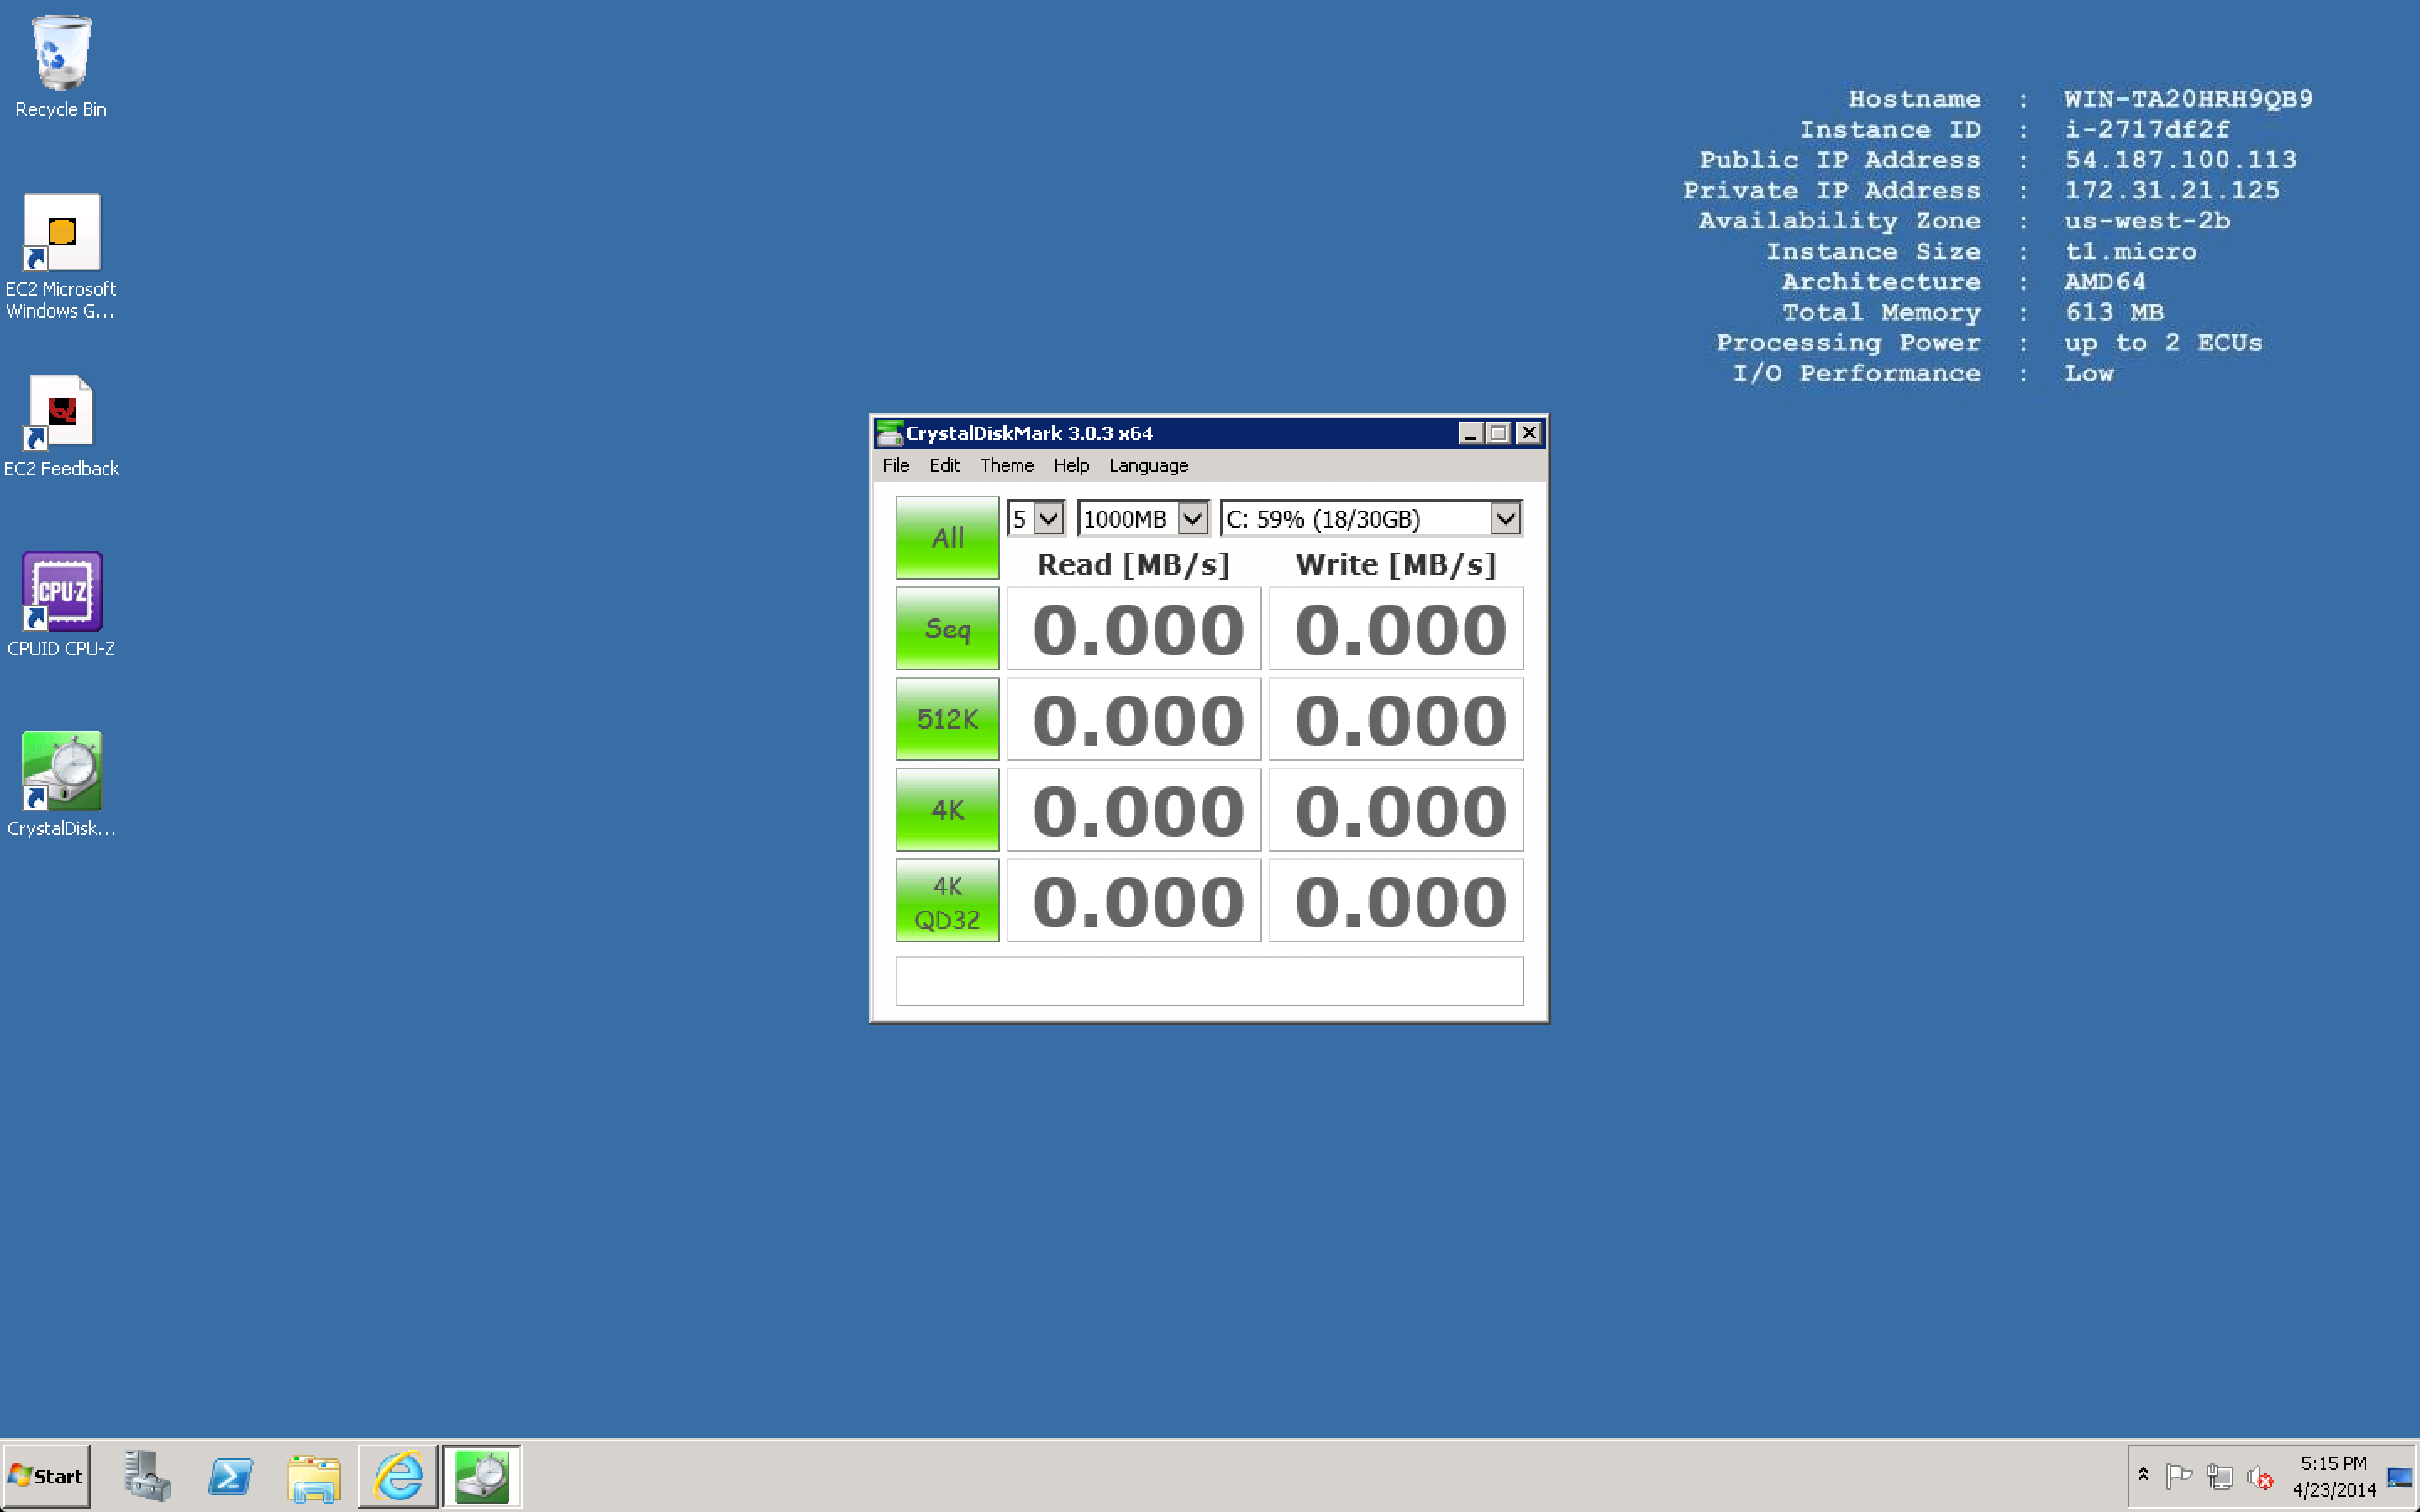
At this stage our Windows servers are up, so what did CPU-Z find? Very interesting results actually. First up EC2 T1.micro:
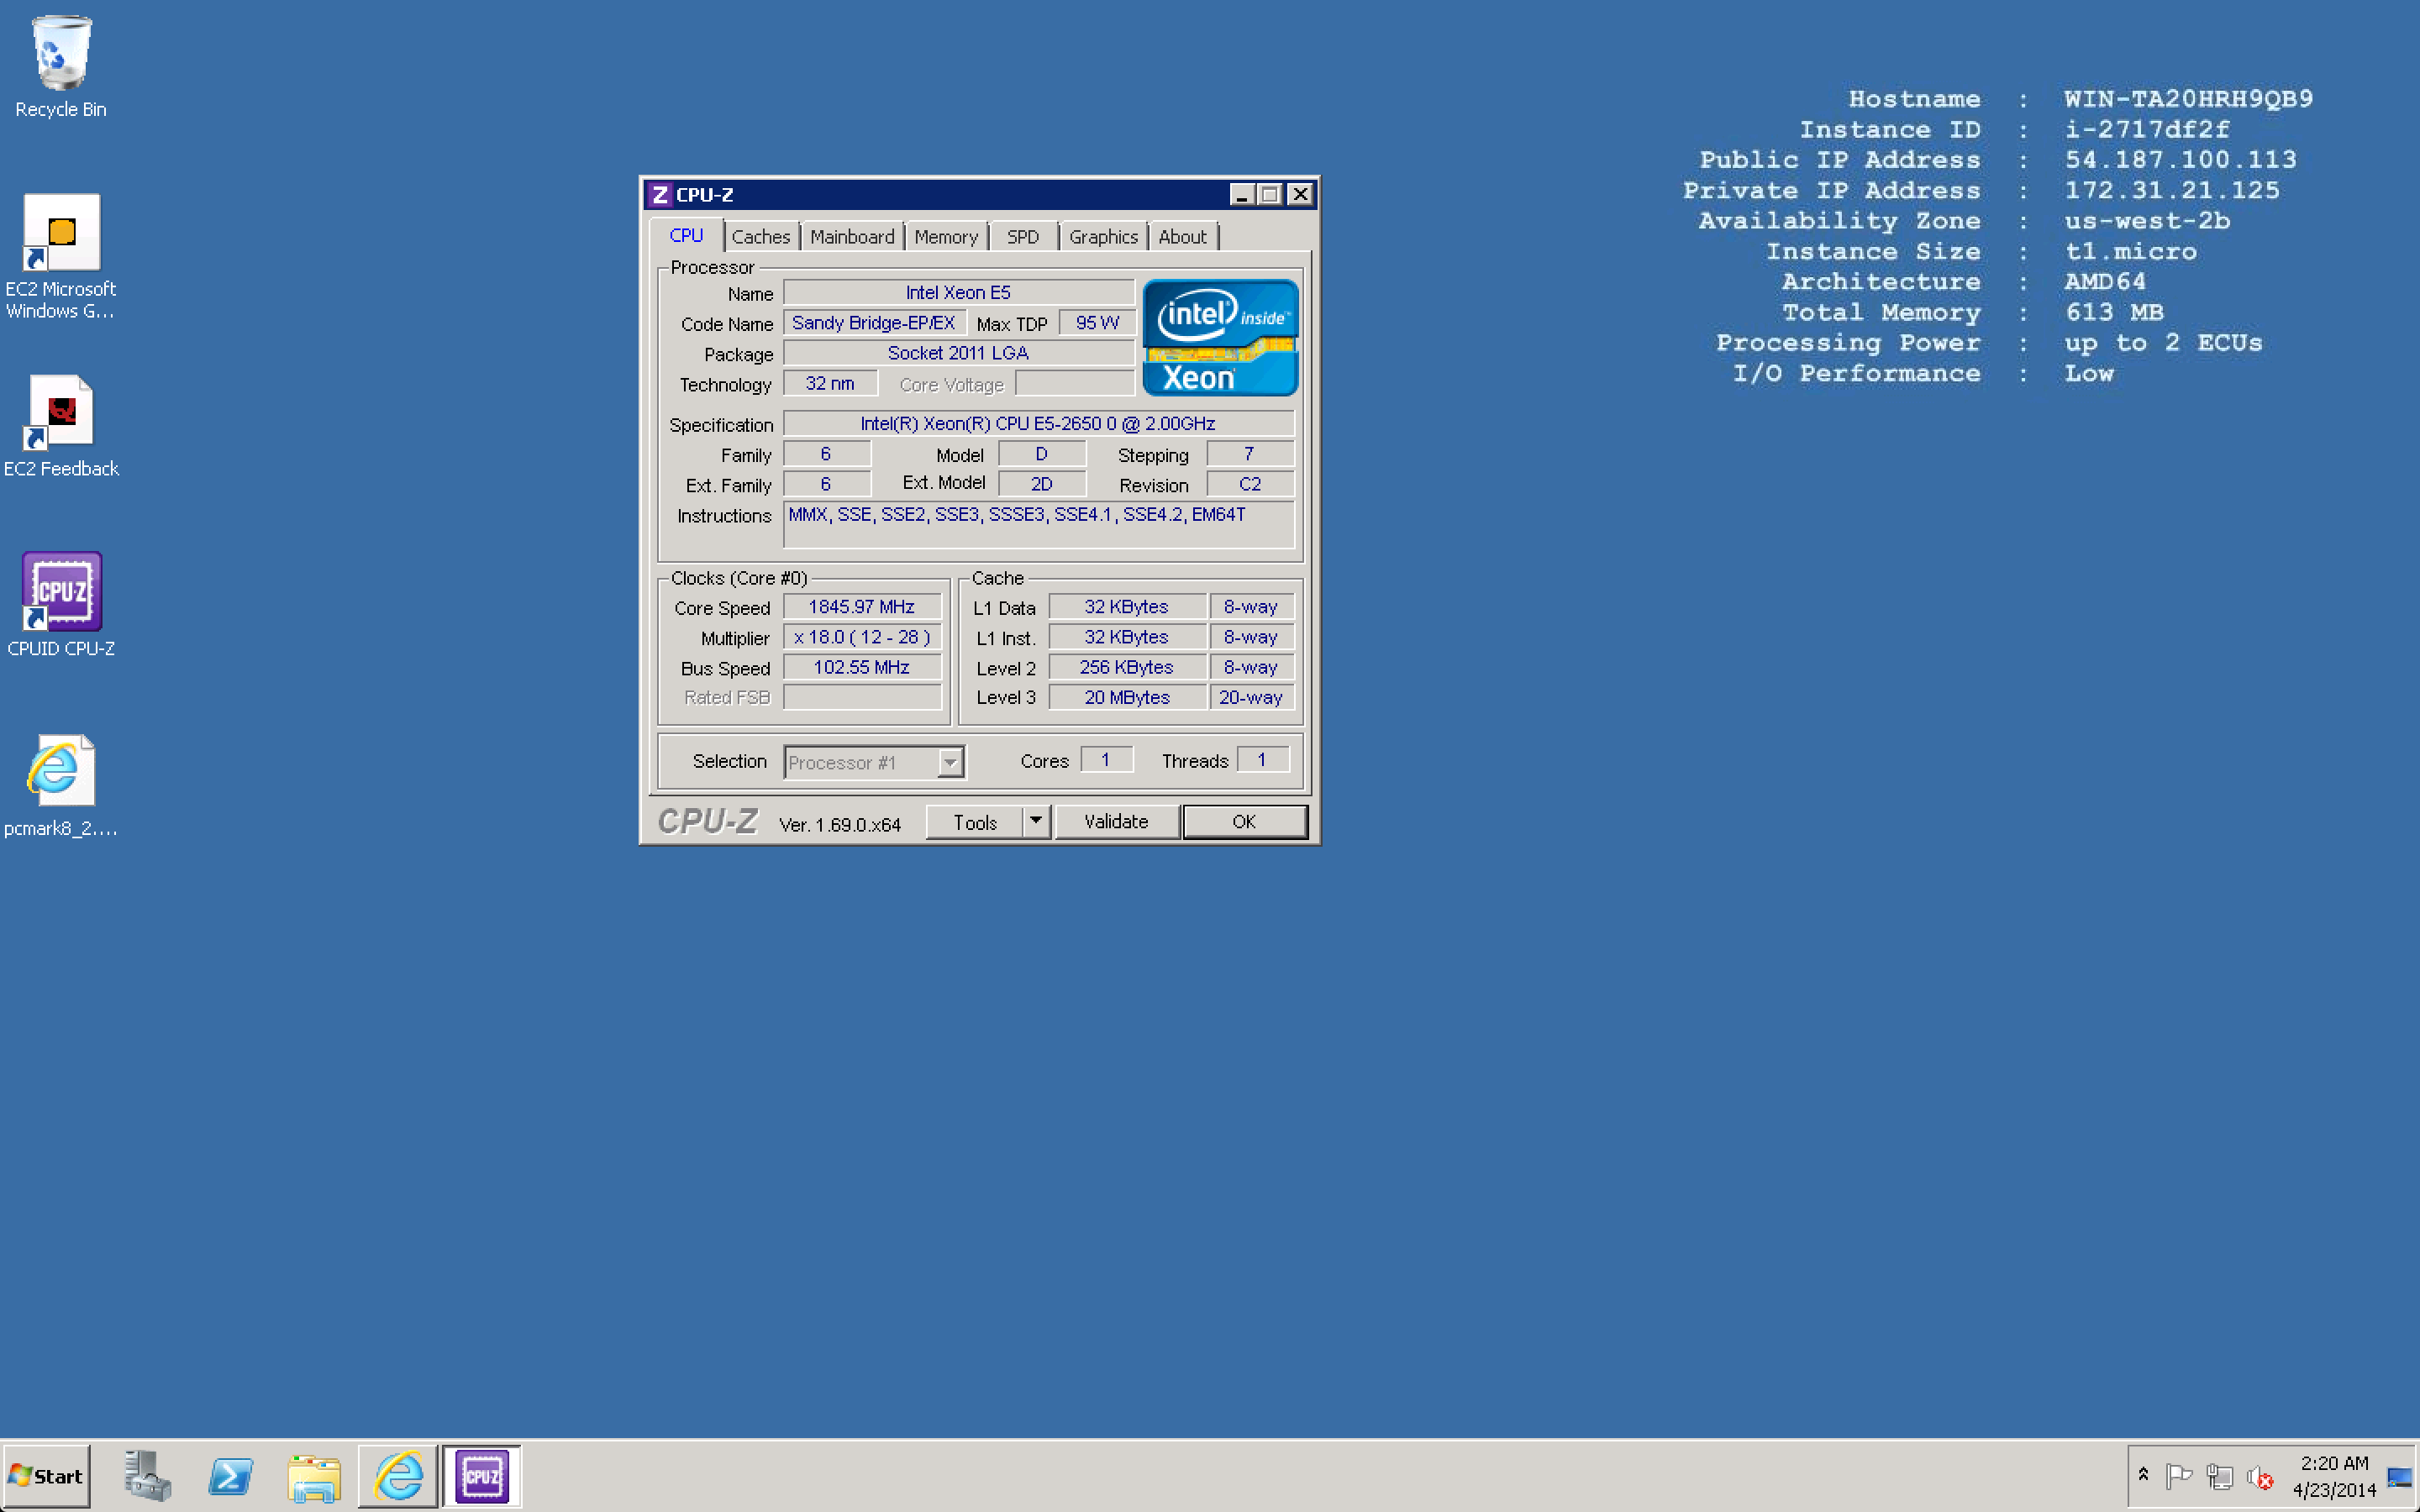
Sandybridge EX, Xeon 2650@2Ghz running at 1.8Ghz with a bus speed of 100Mhz
Next up let’s have a look at the vCHS VM:
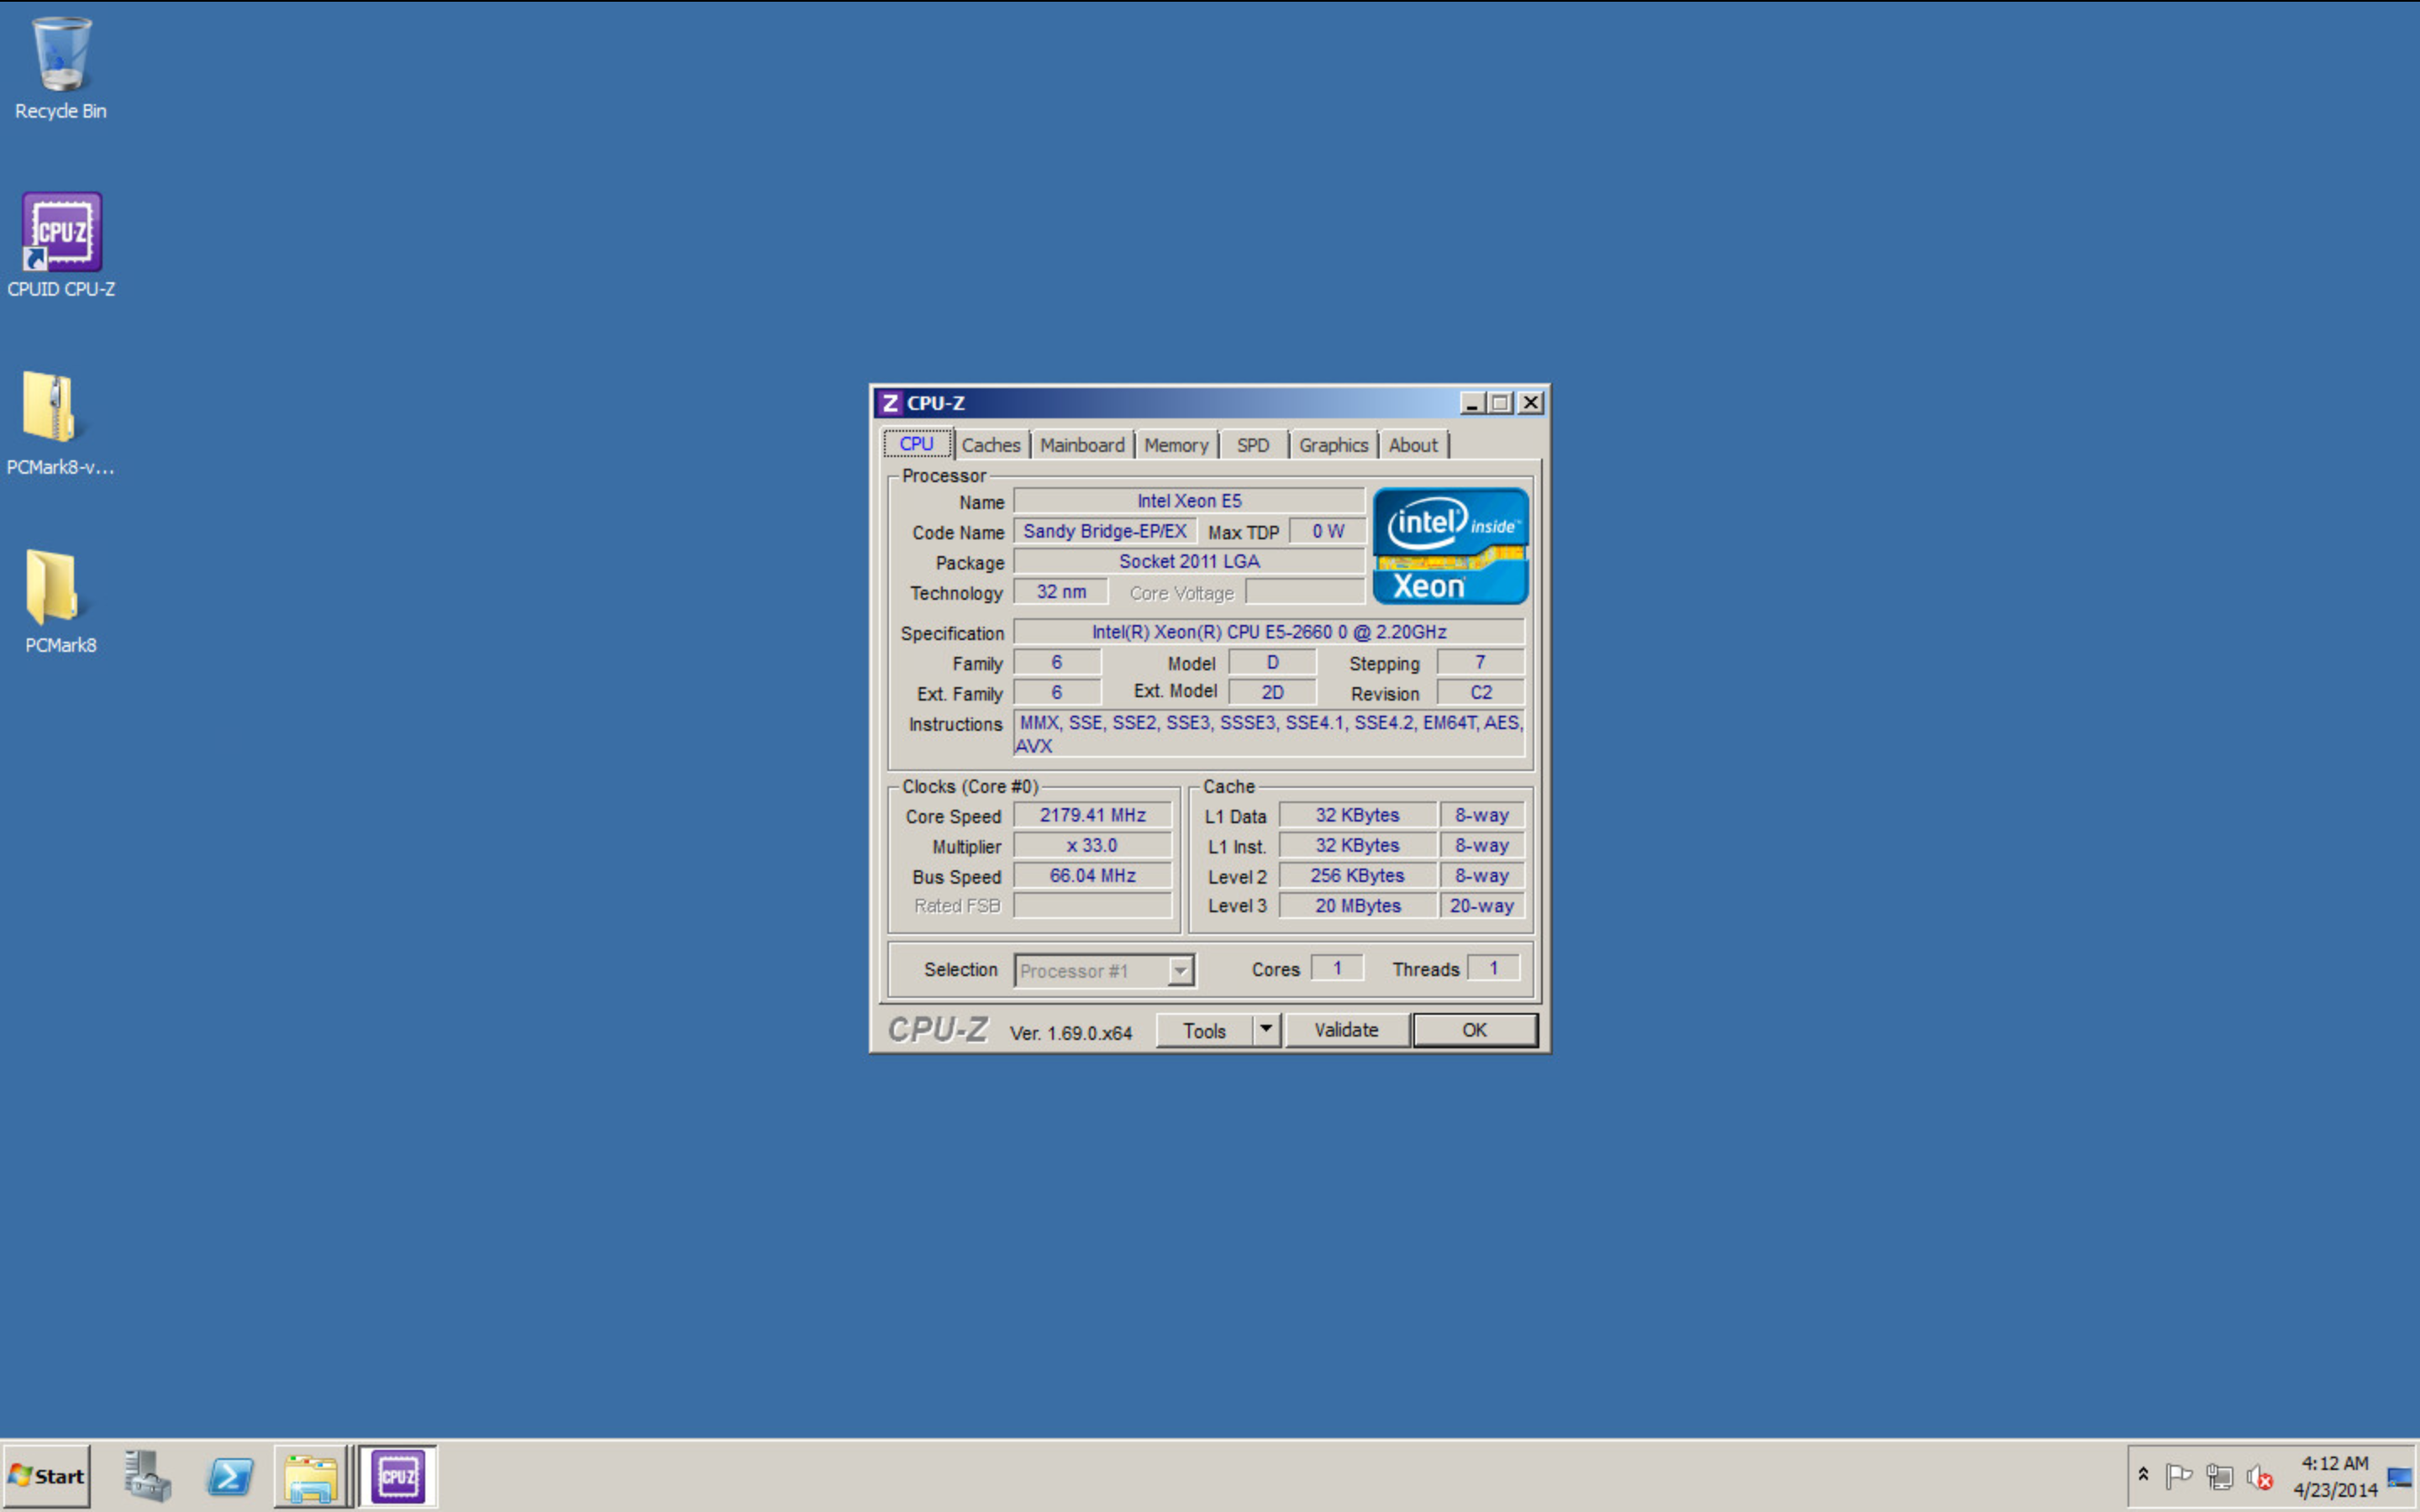
Sandybridge EX, Xeon 2660@2Ghz running at 2.1Ghz with a bus speed of 66Mhz
Why is there a difference in the perceived bus speed of the vCPU? Not sure actually, but it may be a difference in how ESXi presents to the OS vs Xen. In any event, the benchmark results will ultimately tell the tale of the tape here. Next up, let’s take a look at what the network performance was like downloading the (massive) 2.9GB PCMark 8.0 file.
Network Download Performance
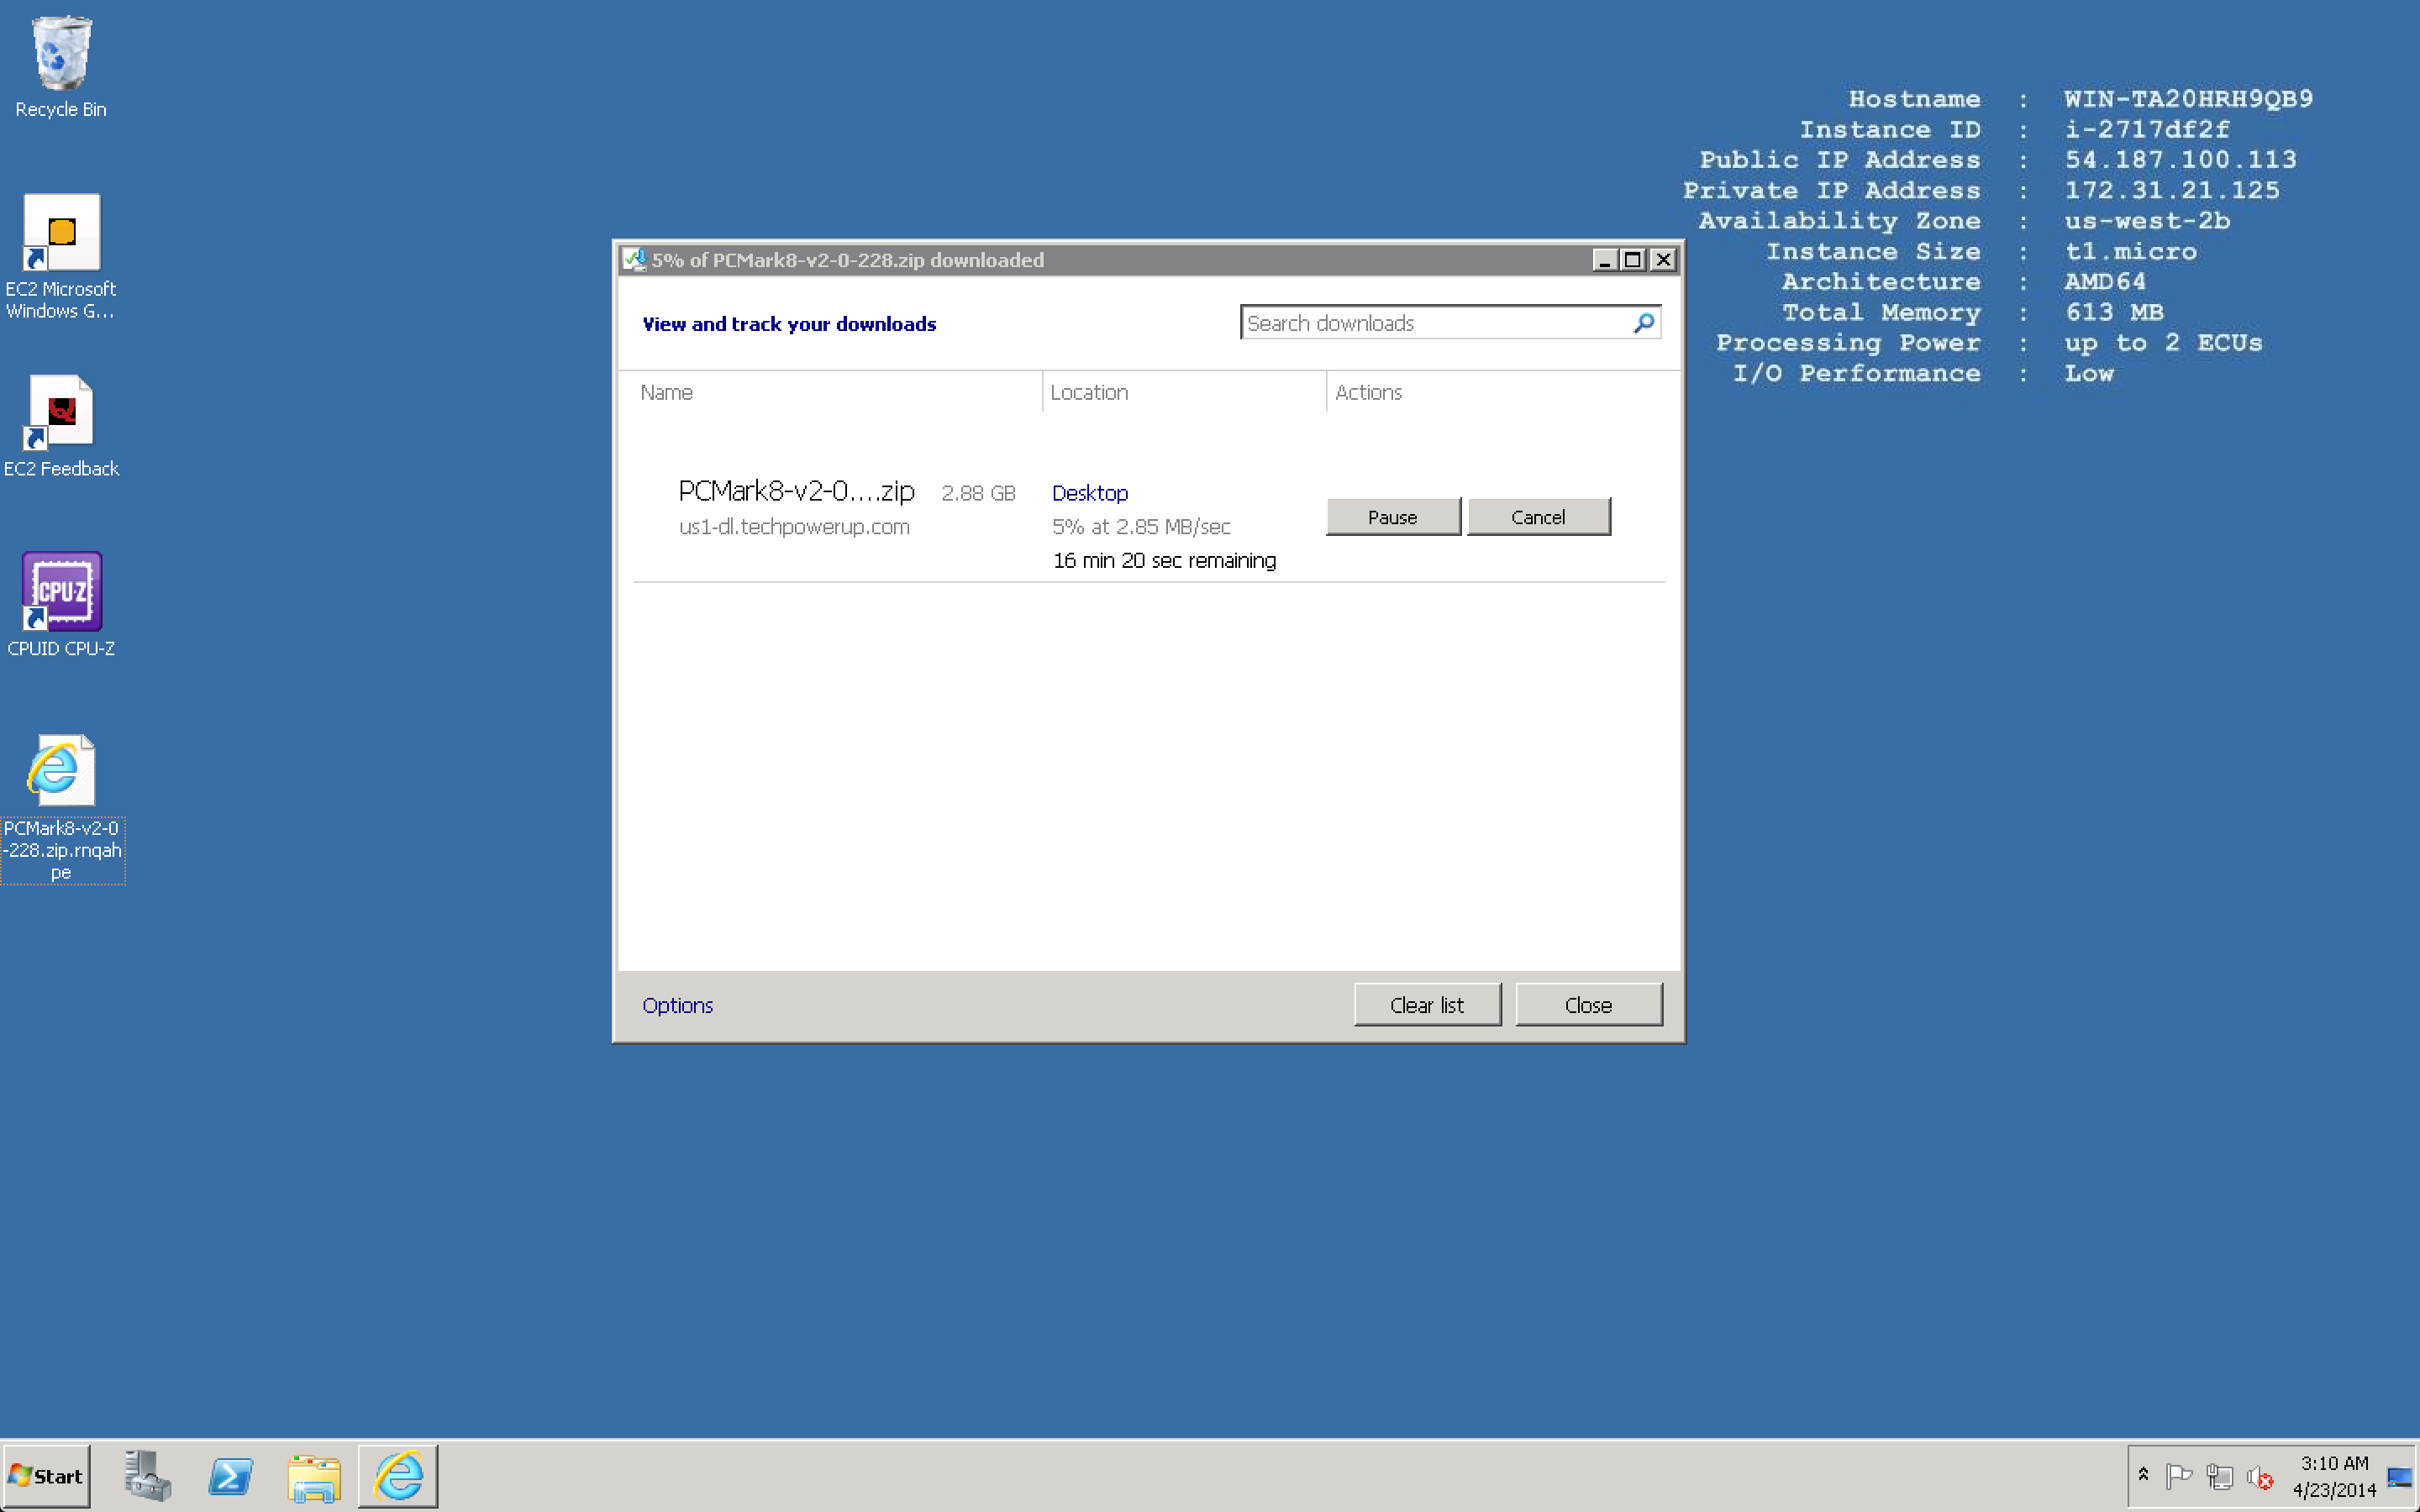
Unfortunately I was not able to pull the package from the same mirror for both servers, but what I did do was choose the highest performing mirror that each server was able to contact. Here is how they stacked up. First up EC2 downloading from Tech Powerup We can see here a 2.85MB/s sustained rate. Not bad for free actually:
And vCHS downloading from Gamers Hell. Huge bandwidth here! 9.5MB/s sustained!
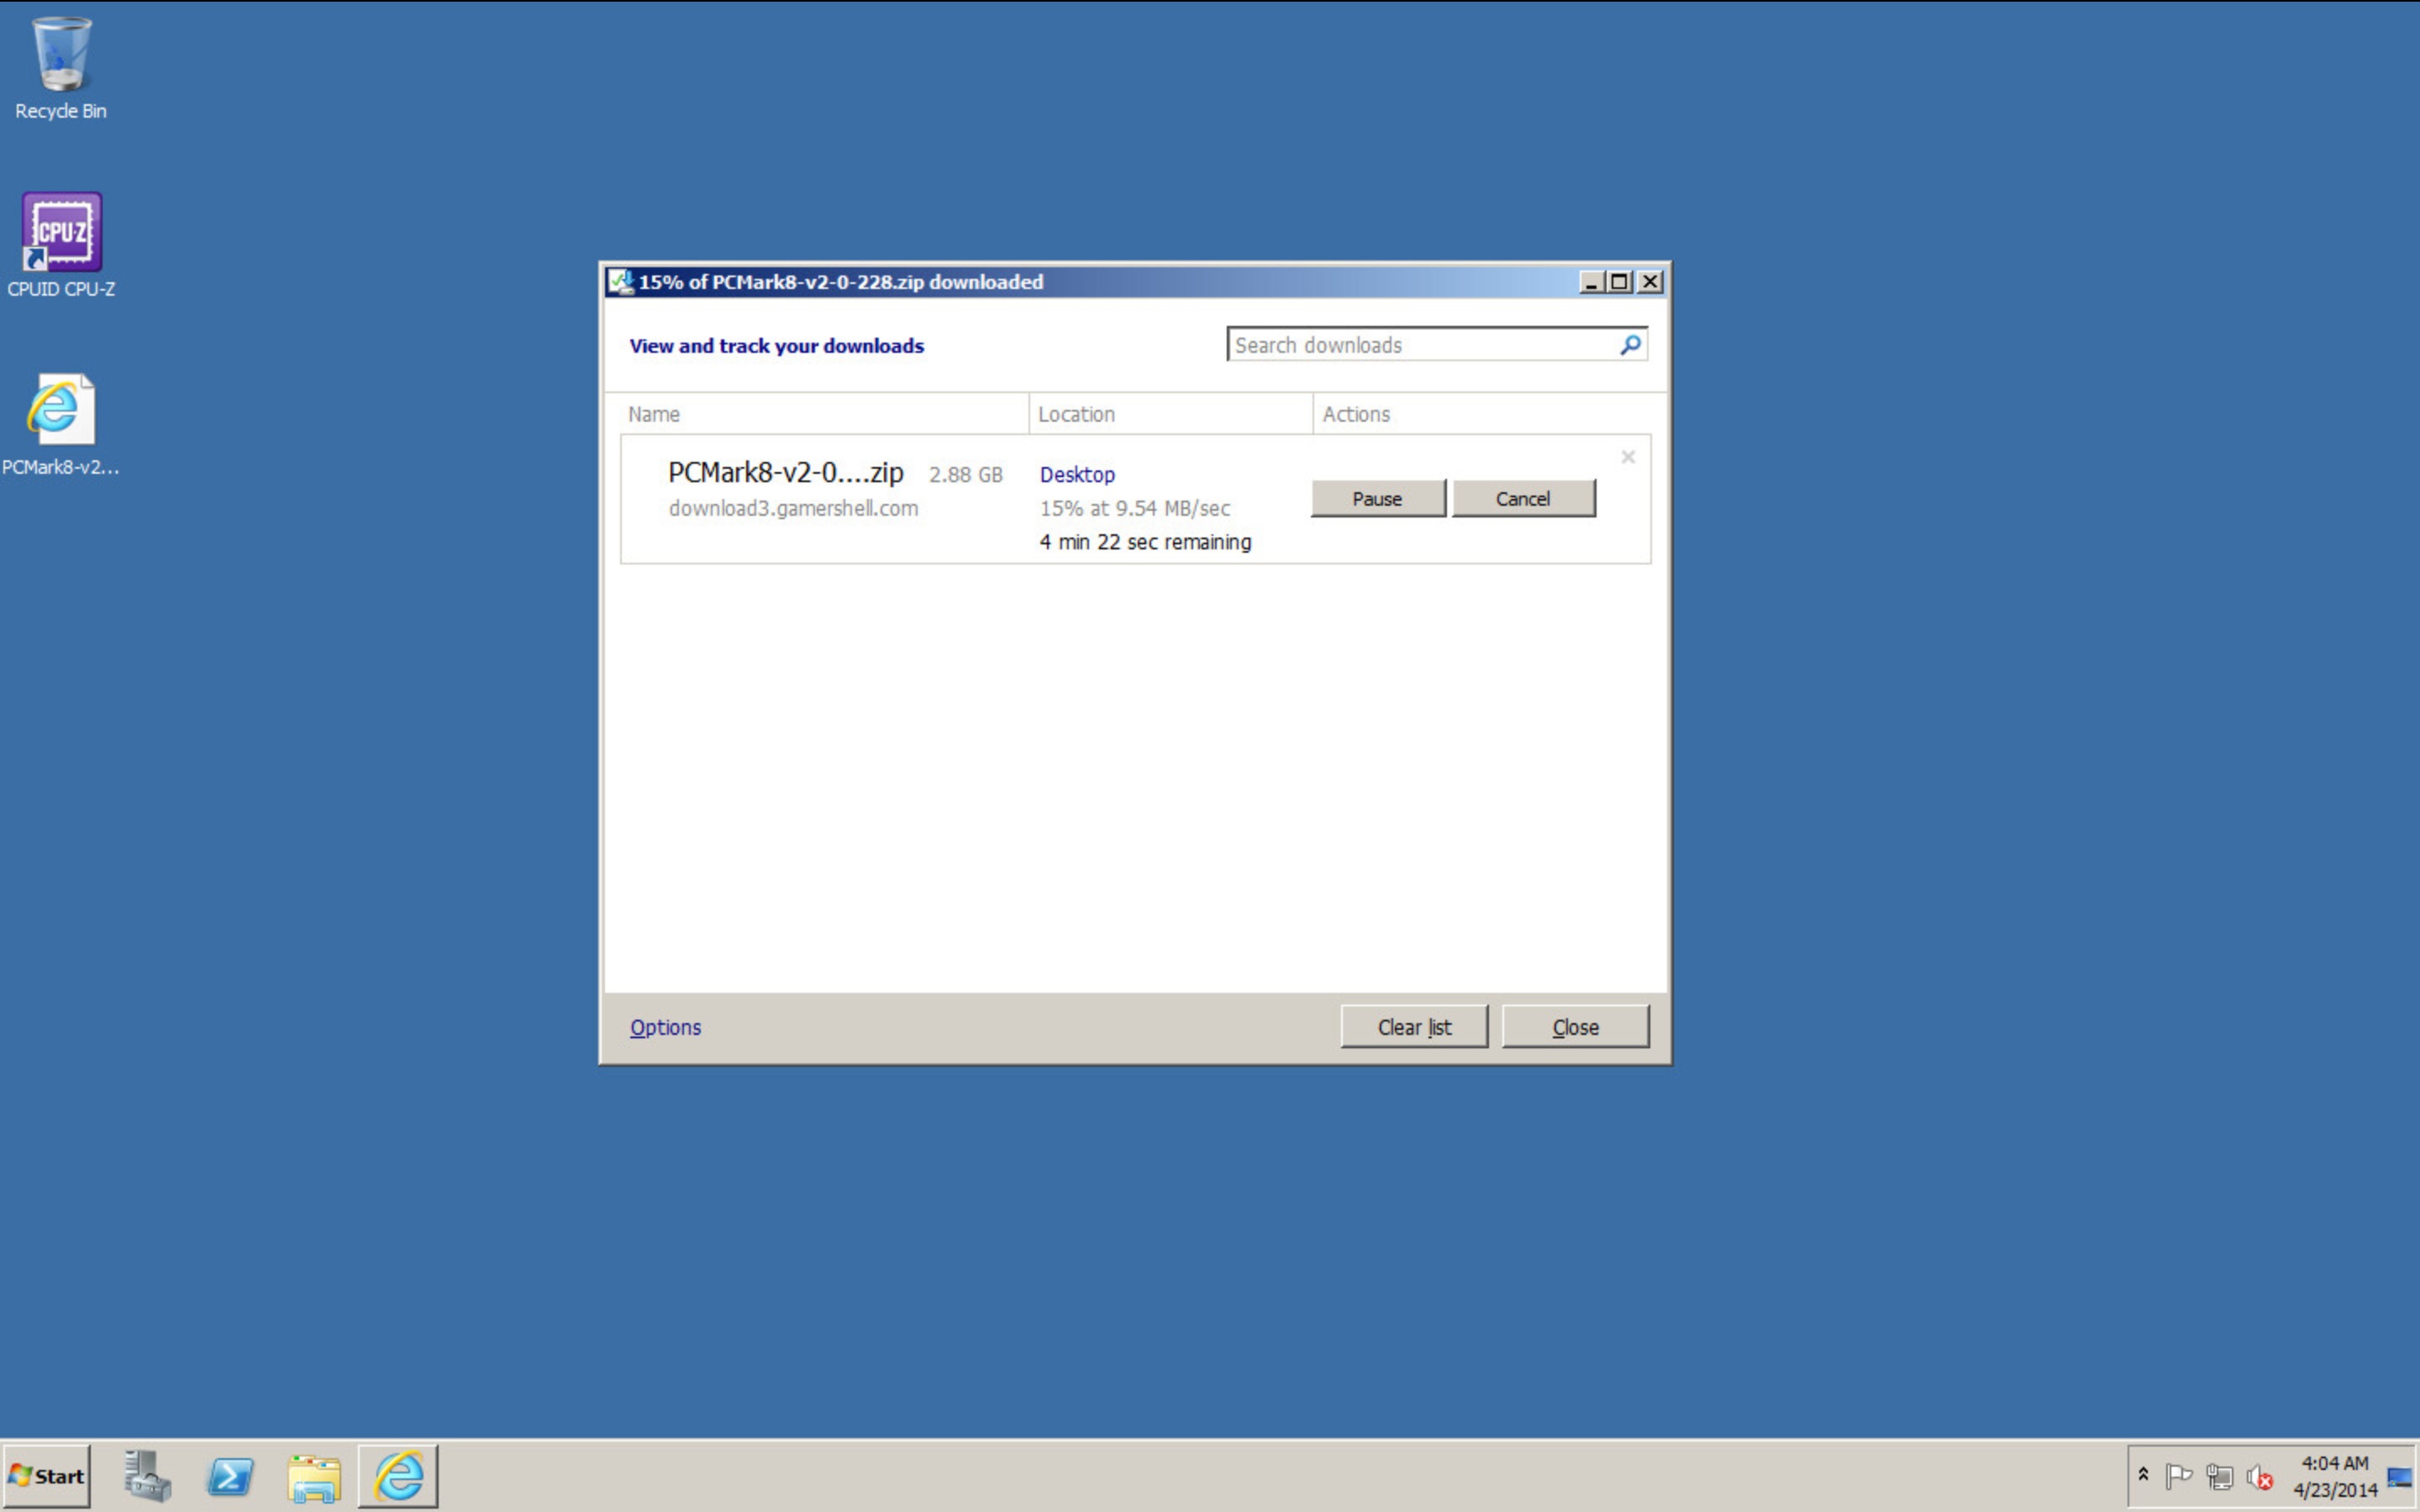
The vCHS VM was able to take full advantage of the empty gateway (only one VM behind it) and consume in excess of the allocated 50Mb/s out to the internet. Super impressive result, and a clear victory, but worth noting that this is compared to the AWS free tier and technically you can launch as many of these free instances as you want. As additional vCHS VMs become active within the dedicated cloud, they will share that bandwidth. Of course bandwidth can be added a la carte, so once again the offerings are not really directly comparable in terms of consumption models.
WINNER: vCHS
PCMark 8 Install and Setup
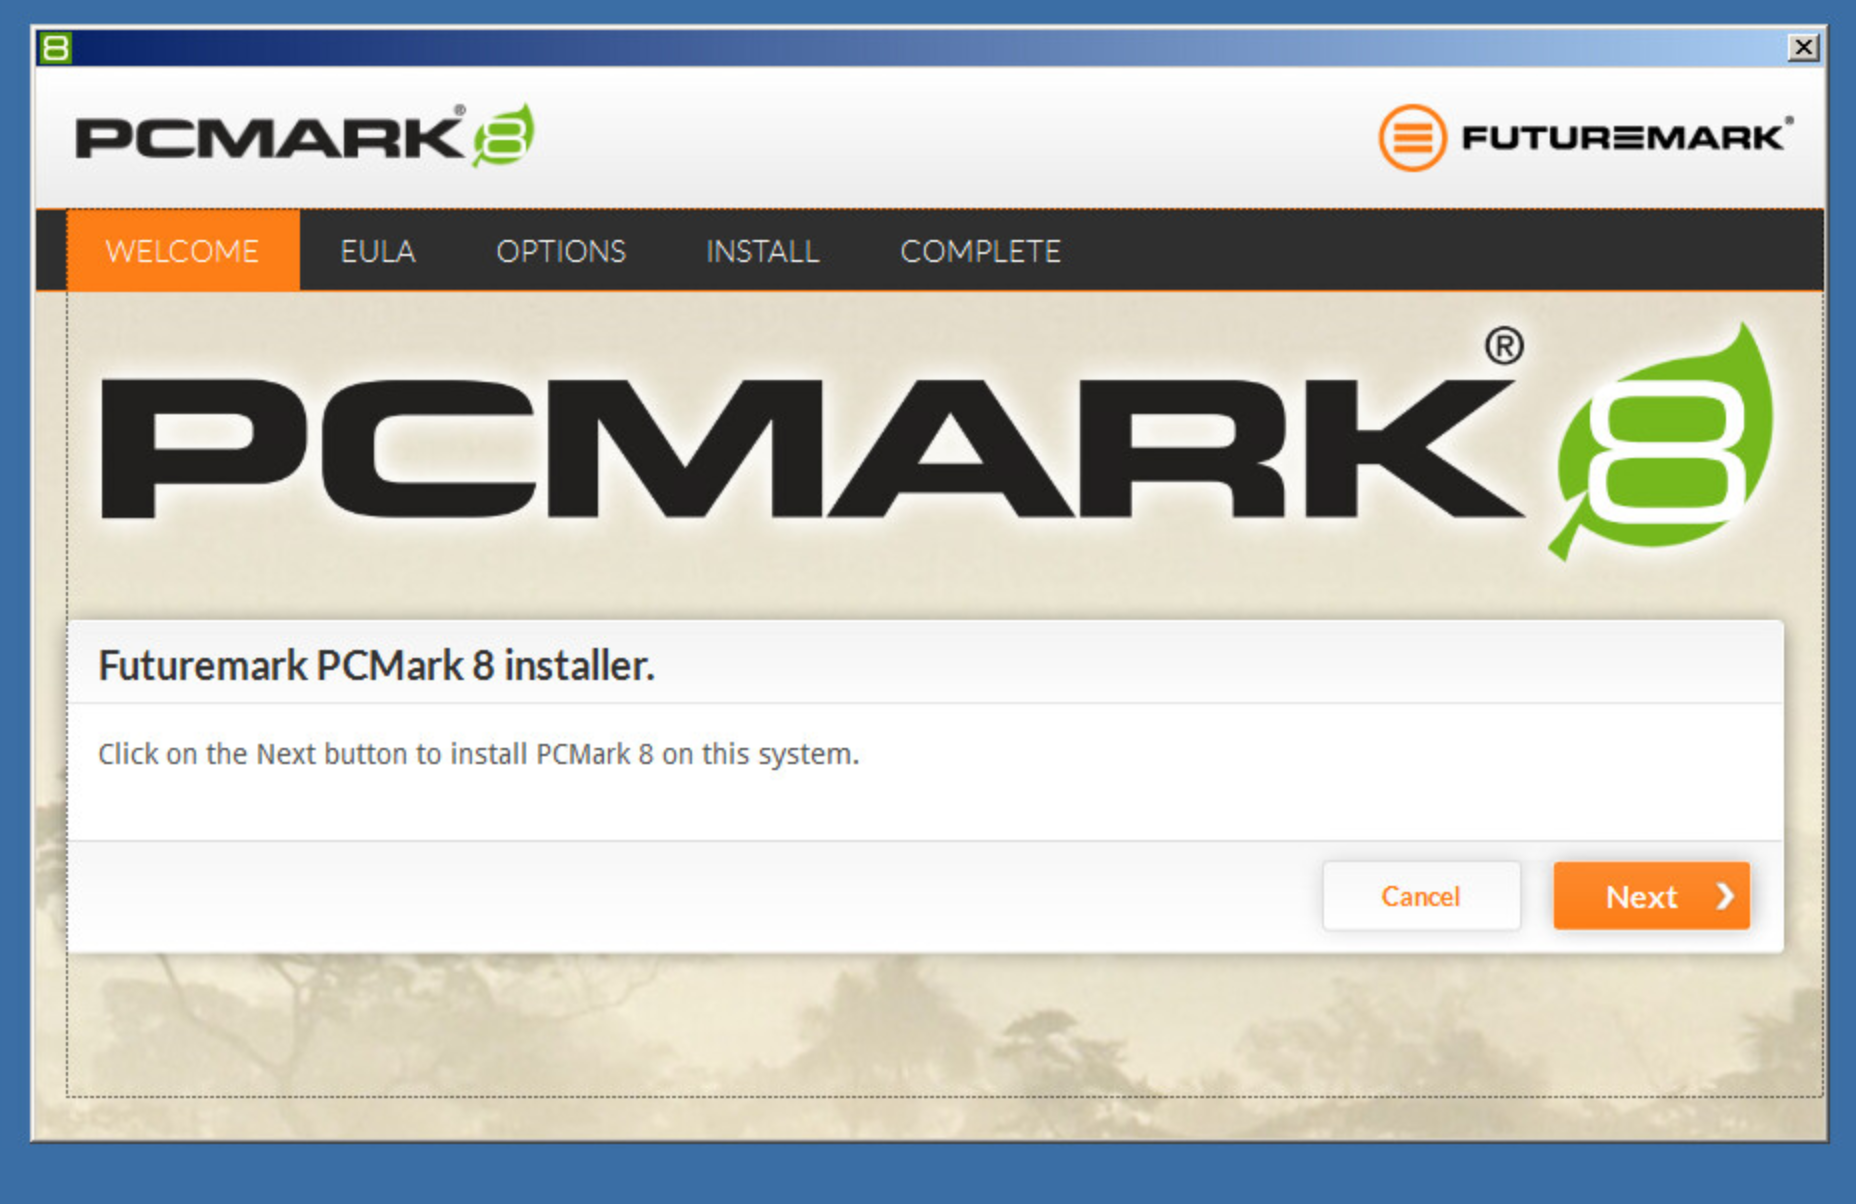
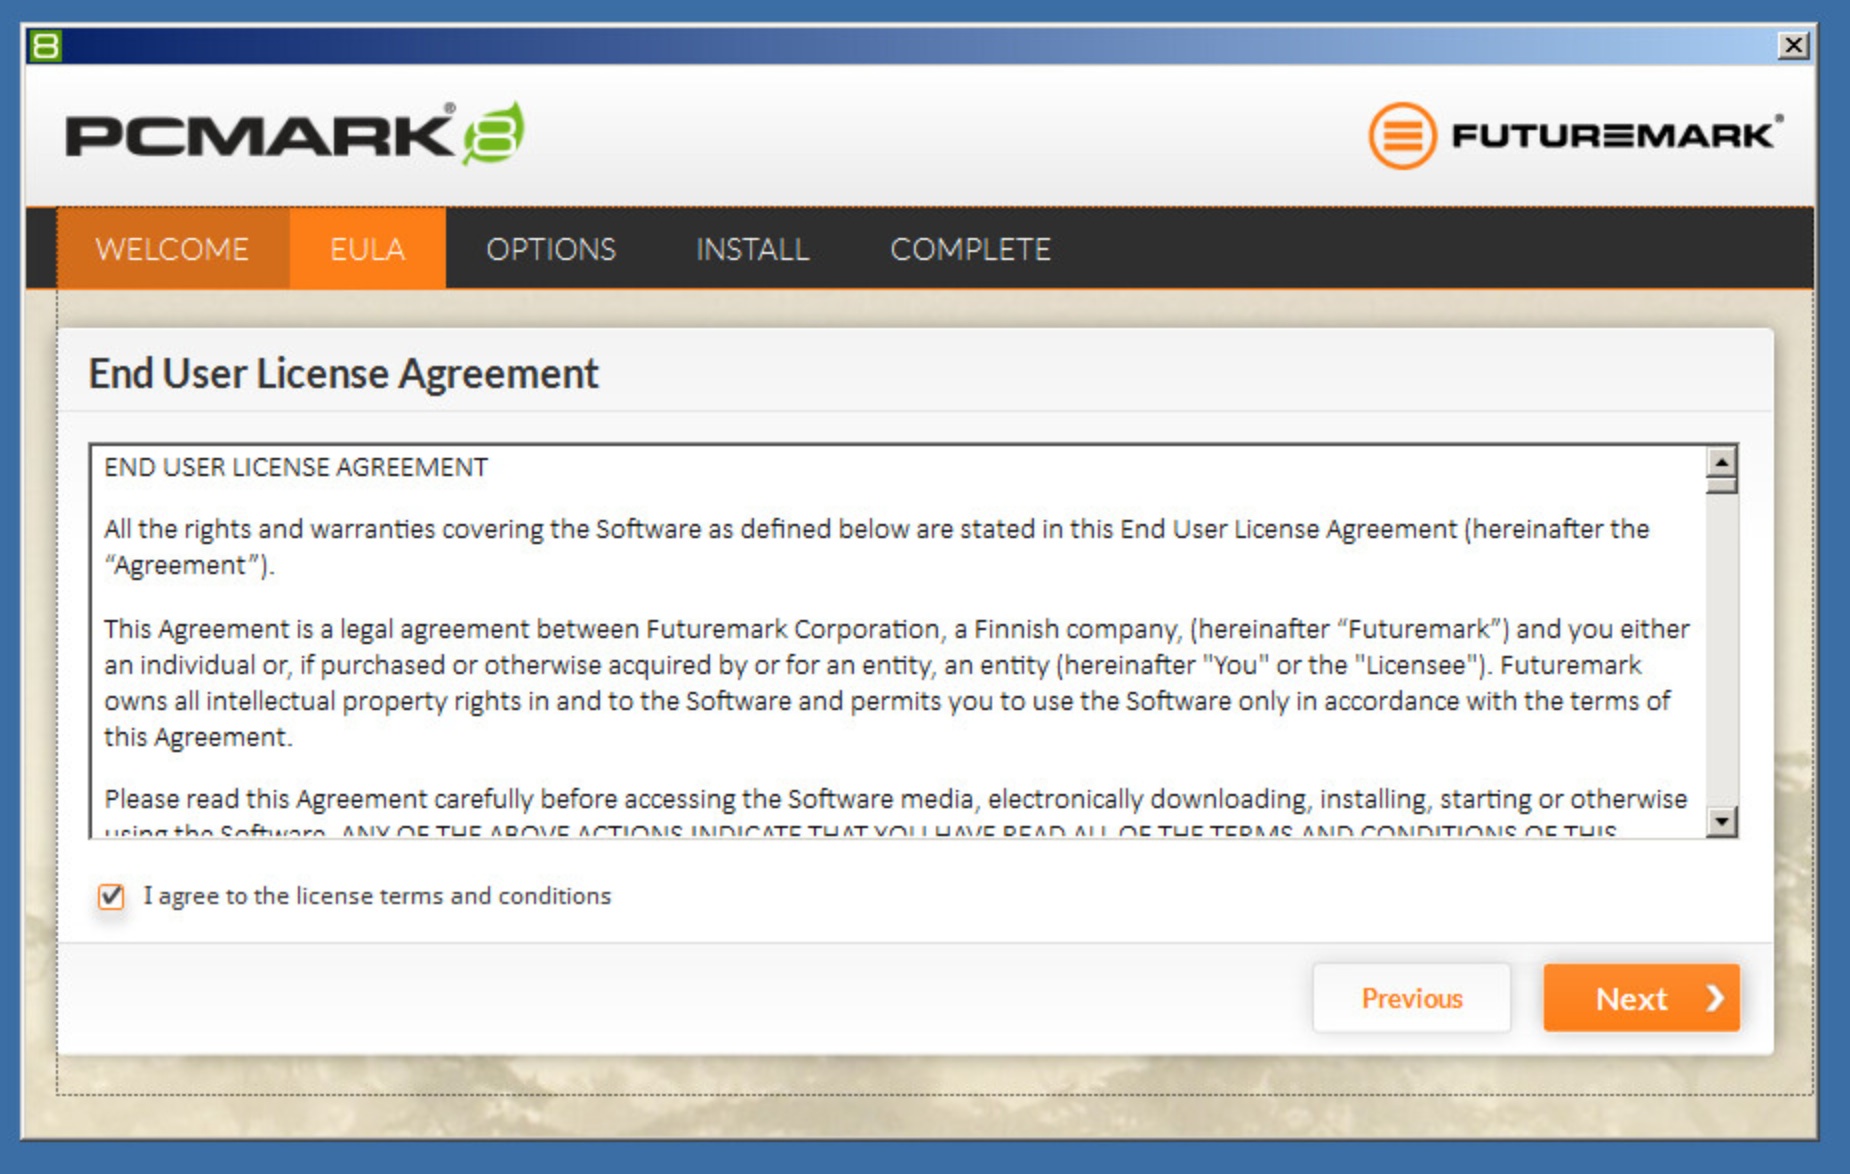
OK, PCMark has been downloaded, so let’s install it. The installation goes as expected with no hiccups and is actually not noticeably slow on either machine which is impressive considering they have sub 1GB RAM and are running 2008 R2. Quick shots of the install just for reference:
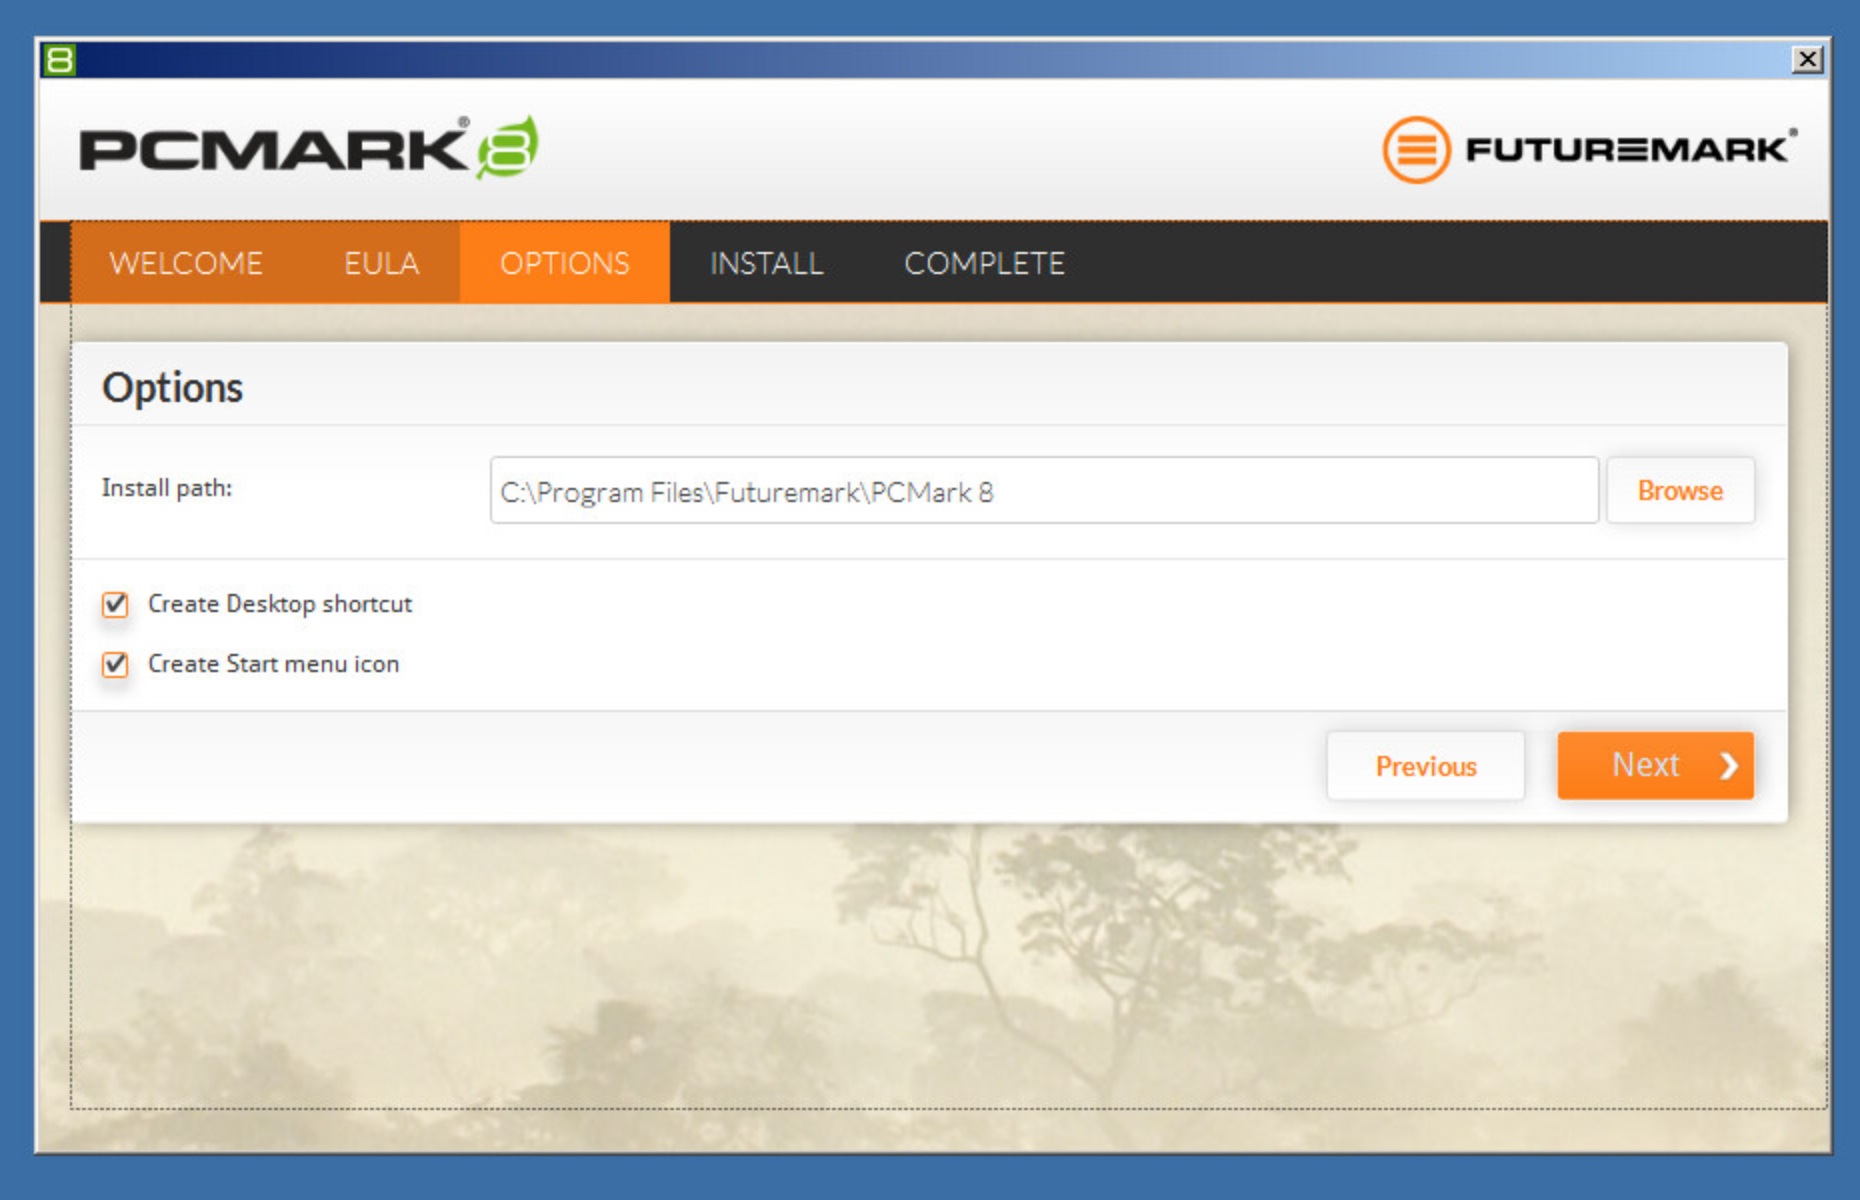
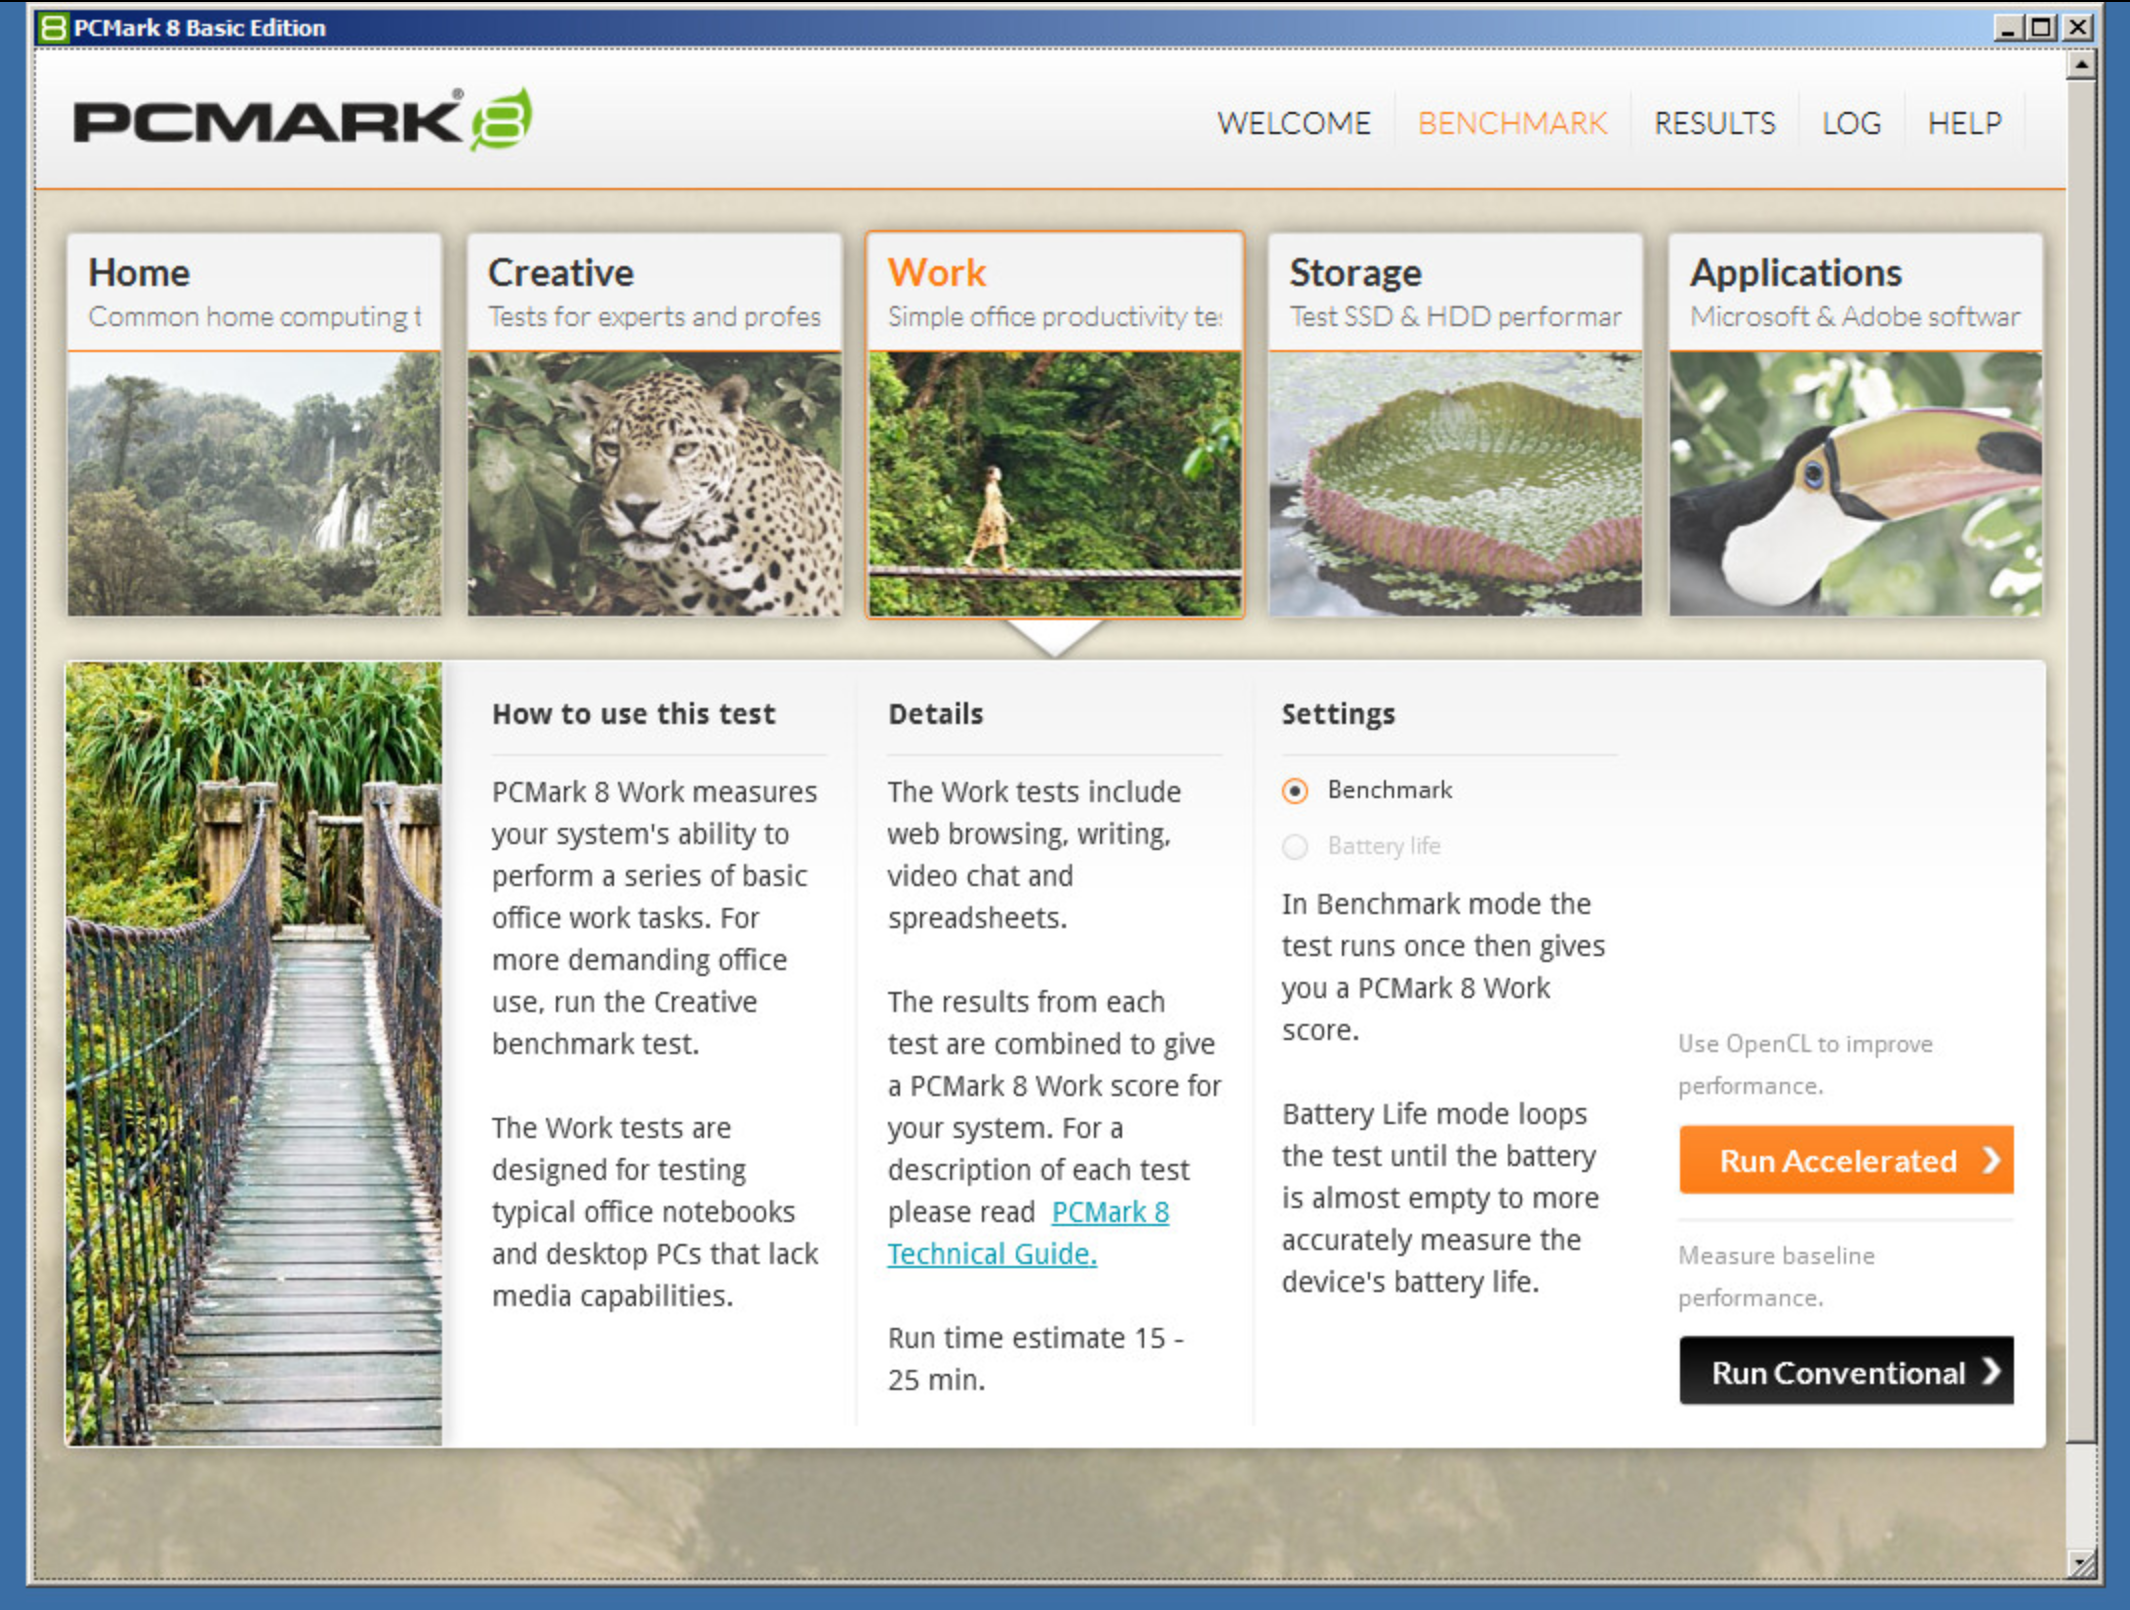
For the actual tests we are going to run the “Work Test”. The other tests require hardware accelerated video which we do not have and are less relevant anyhow since they focus on consumer workloads like gaming and multimedia. In addition, the Work test offers options for “Accelerated”, which leverages OpenCL (and again we have no GPU so not relevant) or “Conventional”. I opted for Conventional which aspires to profile baseline performance:
PCMark 8 Results
Unfortunately this turned out to be a bust on both platforms. I’m not quite sure why, but it ended up failing at the same point for both EC2 and vCHS. The failure point was run 4, test 1, of the Here are two shots of the action in progress:

Not sure what’s going on here, but I will take a deeper look and report back.
WINNER: Draw – both failed to complete the test
Crystal DiskMark 3.0.3 Results
CrystalDiskMark ran like a charm and turned up a massive disparity between the base storage offering of the two platforms. This is not unexpected as described above, the vCHS standard storage offering is SSD accelerated. Presumably there will be a lower tier, lower cost, offering coming and one can assume that there will also be a configurable IOPs version (to compete with pIOPs) coming as well. For now though, vCHS base storage is very good indeed! Here is the test mix:
Standard test suite – 5 run throughs for each tier, 1GB data set and a mix of sequential read, 512K random, 4K random and 4K QD32. QD32 is a test of native command queuing on a disk (QD = queue depth) with a queue depth set to 32 operations. If a disk does not support native command queuing (NCQ) then performance on this test is typically dismal. vCHS is iSCSI storage and EBS is proprietary AWS block network attach, so this will be an interesting result to take a look at. Here is how EBS performed:

Not too bad actually! 100MB/s sequential read is excellent, but what’s extremely impressive is the random I/O performance. In particular, the 4K QD32 is quite good at 33MB/s. The write speeds, of course, are significantly lower, but still quite good. If we extrapolate IOPs, we get 716 IOPs. That’s shockingly good really. Of course there is no guarantee this performance will be consistently delivered (hence the need for pIOPs), but it does show what even EBS standard is potentially capable of. For comparison, here are the single disk results (as local DAS) for a Western Digital Red 3TB drive courtesy of Legit Reviews:
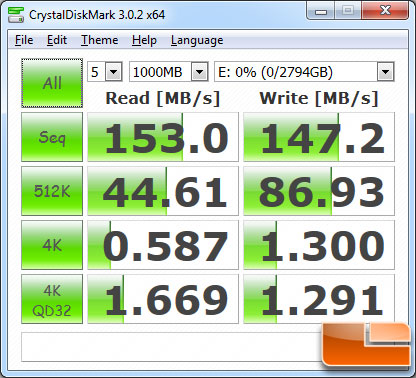
As with most spinning rust disks, the small random results are just abysmal. EBS kills it here thanks to a really well implemented network attach system since we know EBS standard isn’t using fast disks on the backend. So it looks like cloud is actually hanging pretty well with physical DAS (exceeding it really since random I/O performance is almost always more important than sequential). How does vCHS stack up? let’s take a look:
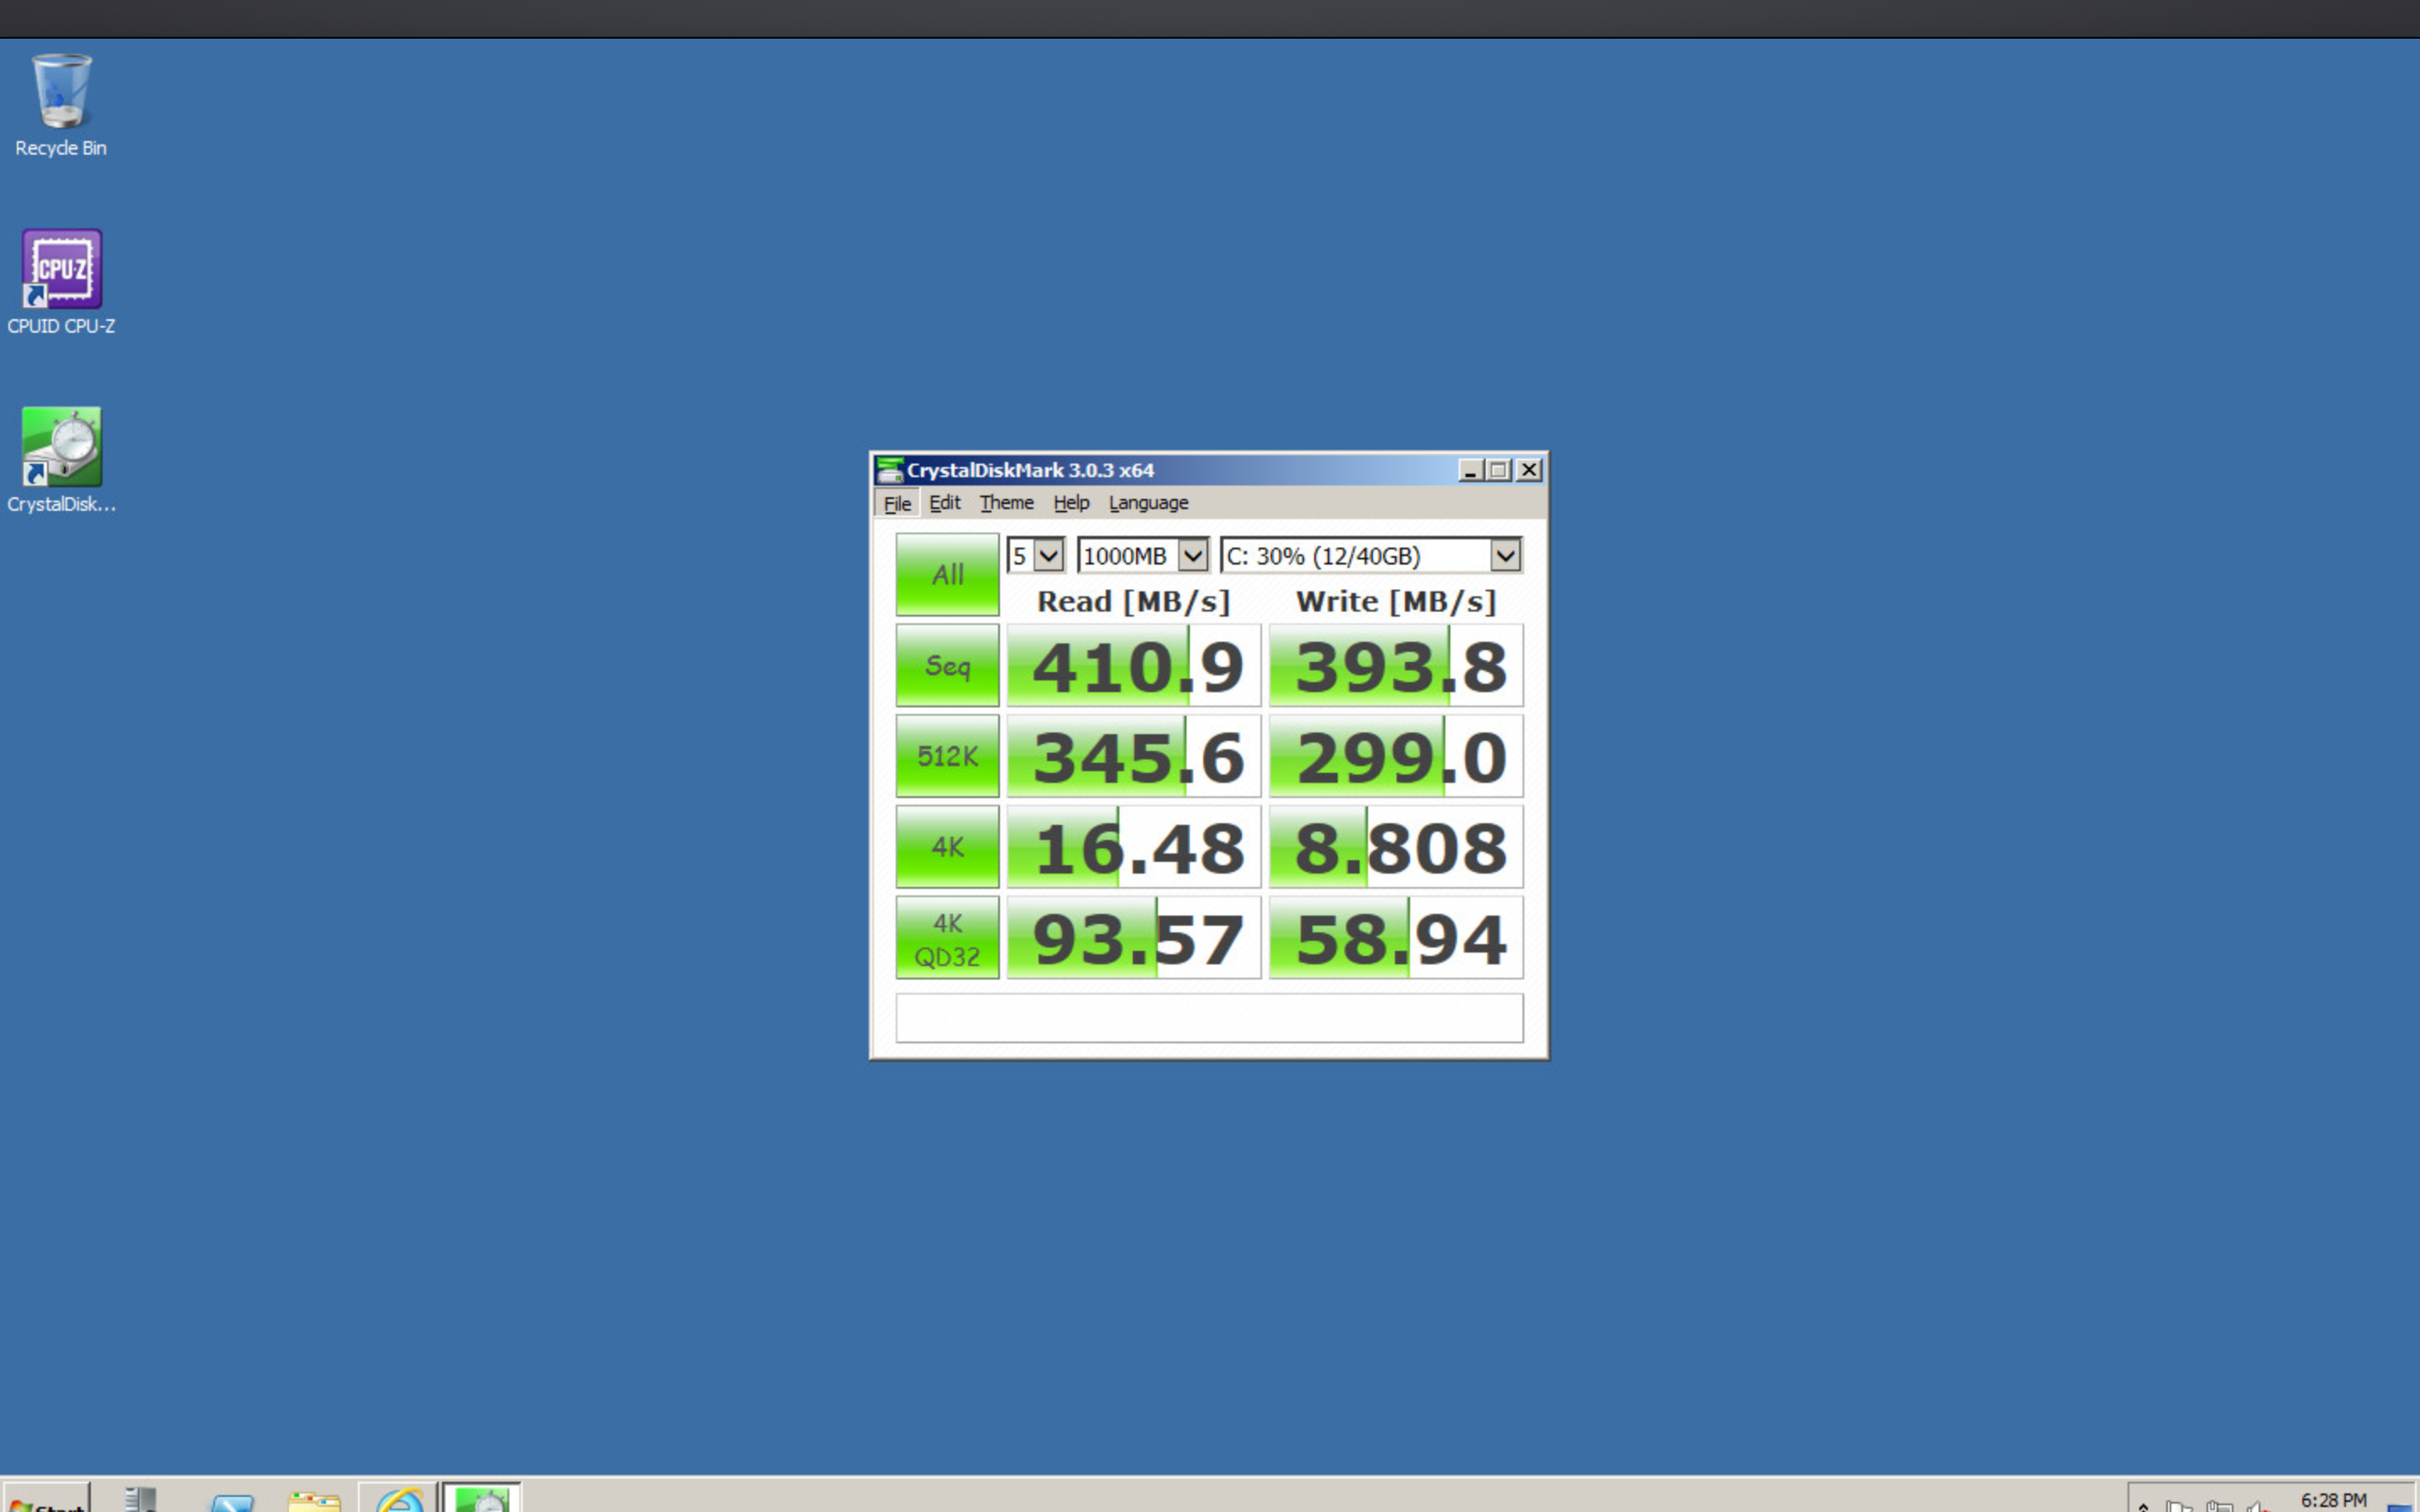
Wow! vCHS destroys the respectable EBS standard results! This is a really really decisive victory for vCHS SSD accelerated storage. Just look at that 4K random write score! We’re talking about 2200 IOPs in random writes! Phenomenal showing for vCHS. This is two victories for vCHS. Will it sweep? Let’s have a look at compute.
WINNER: vCHS
SiSoft Sandra Lite Results
SiSoft Sandra was configured with the network server off since both test runs were stand alone. First up was the Overall System Performance test. Here is a quick run through of the test setup process:
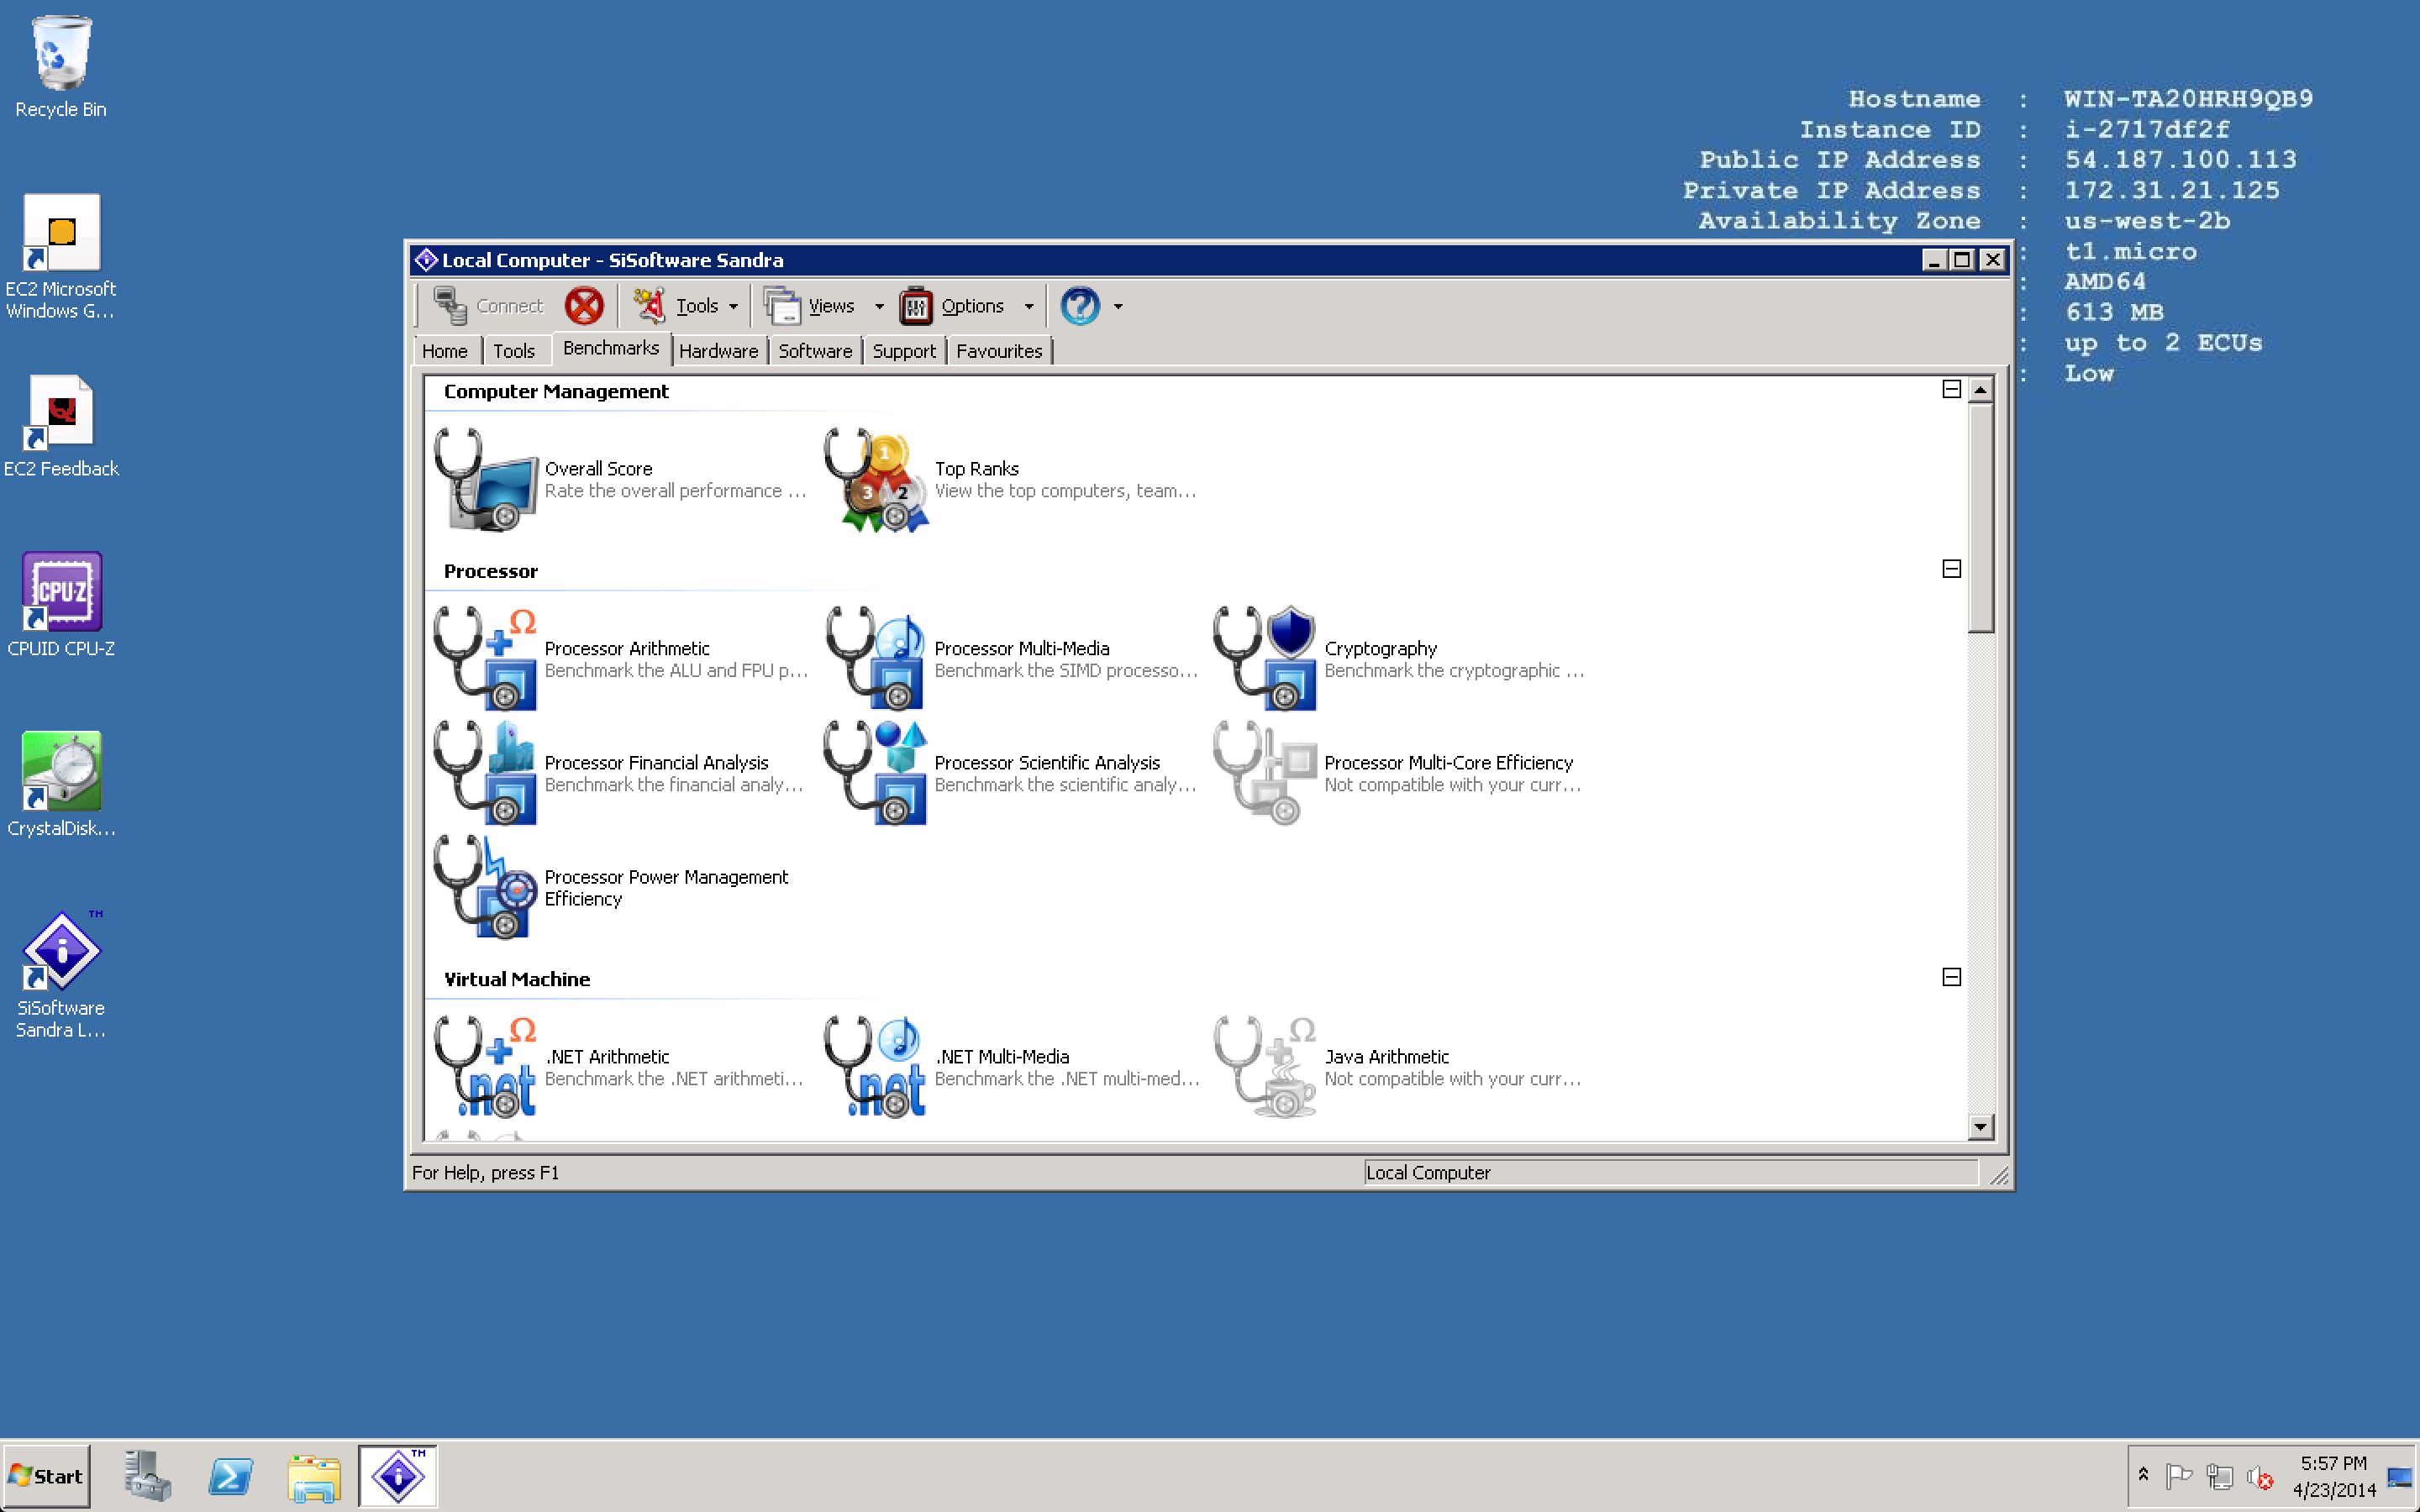
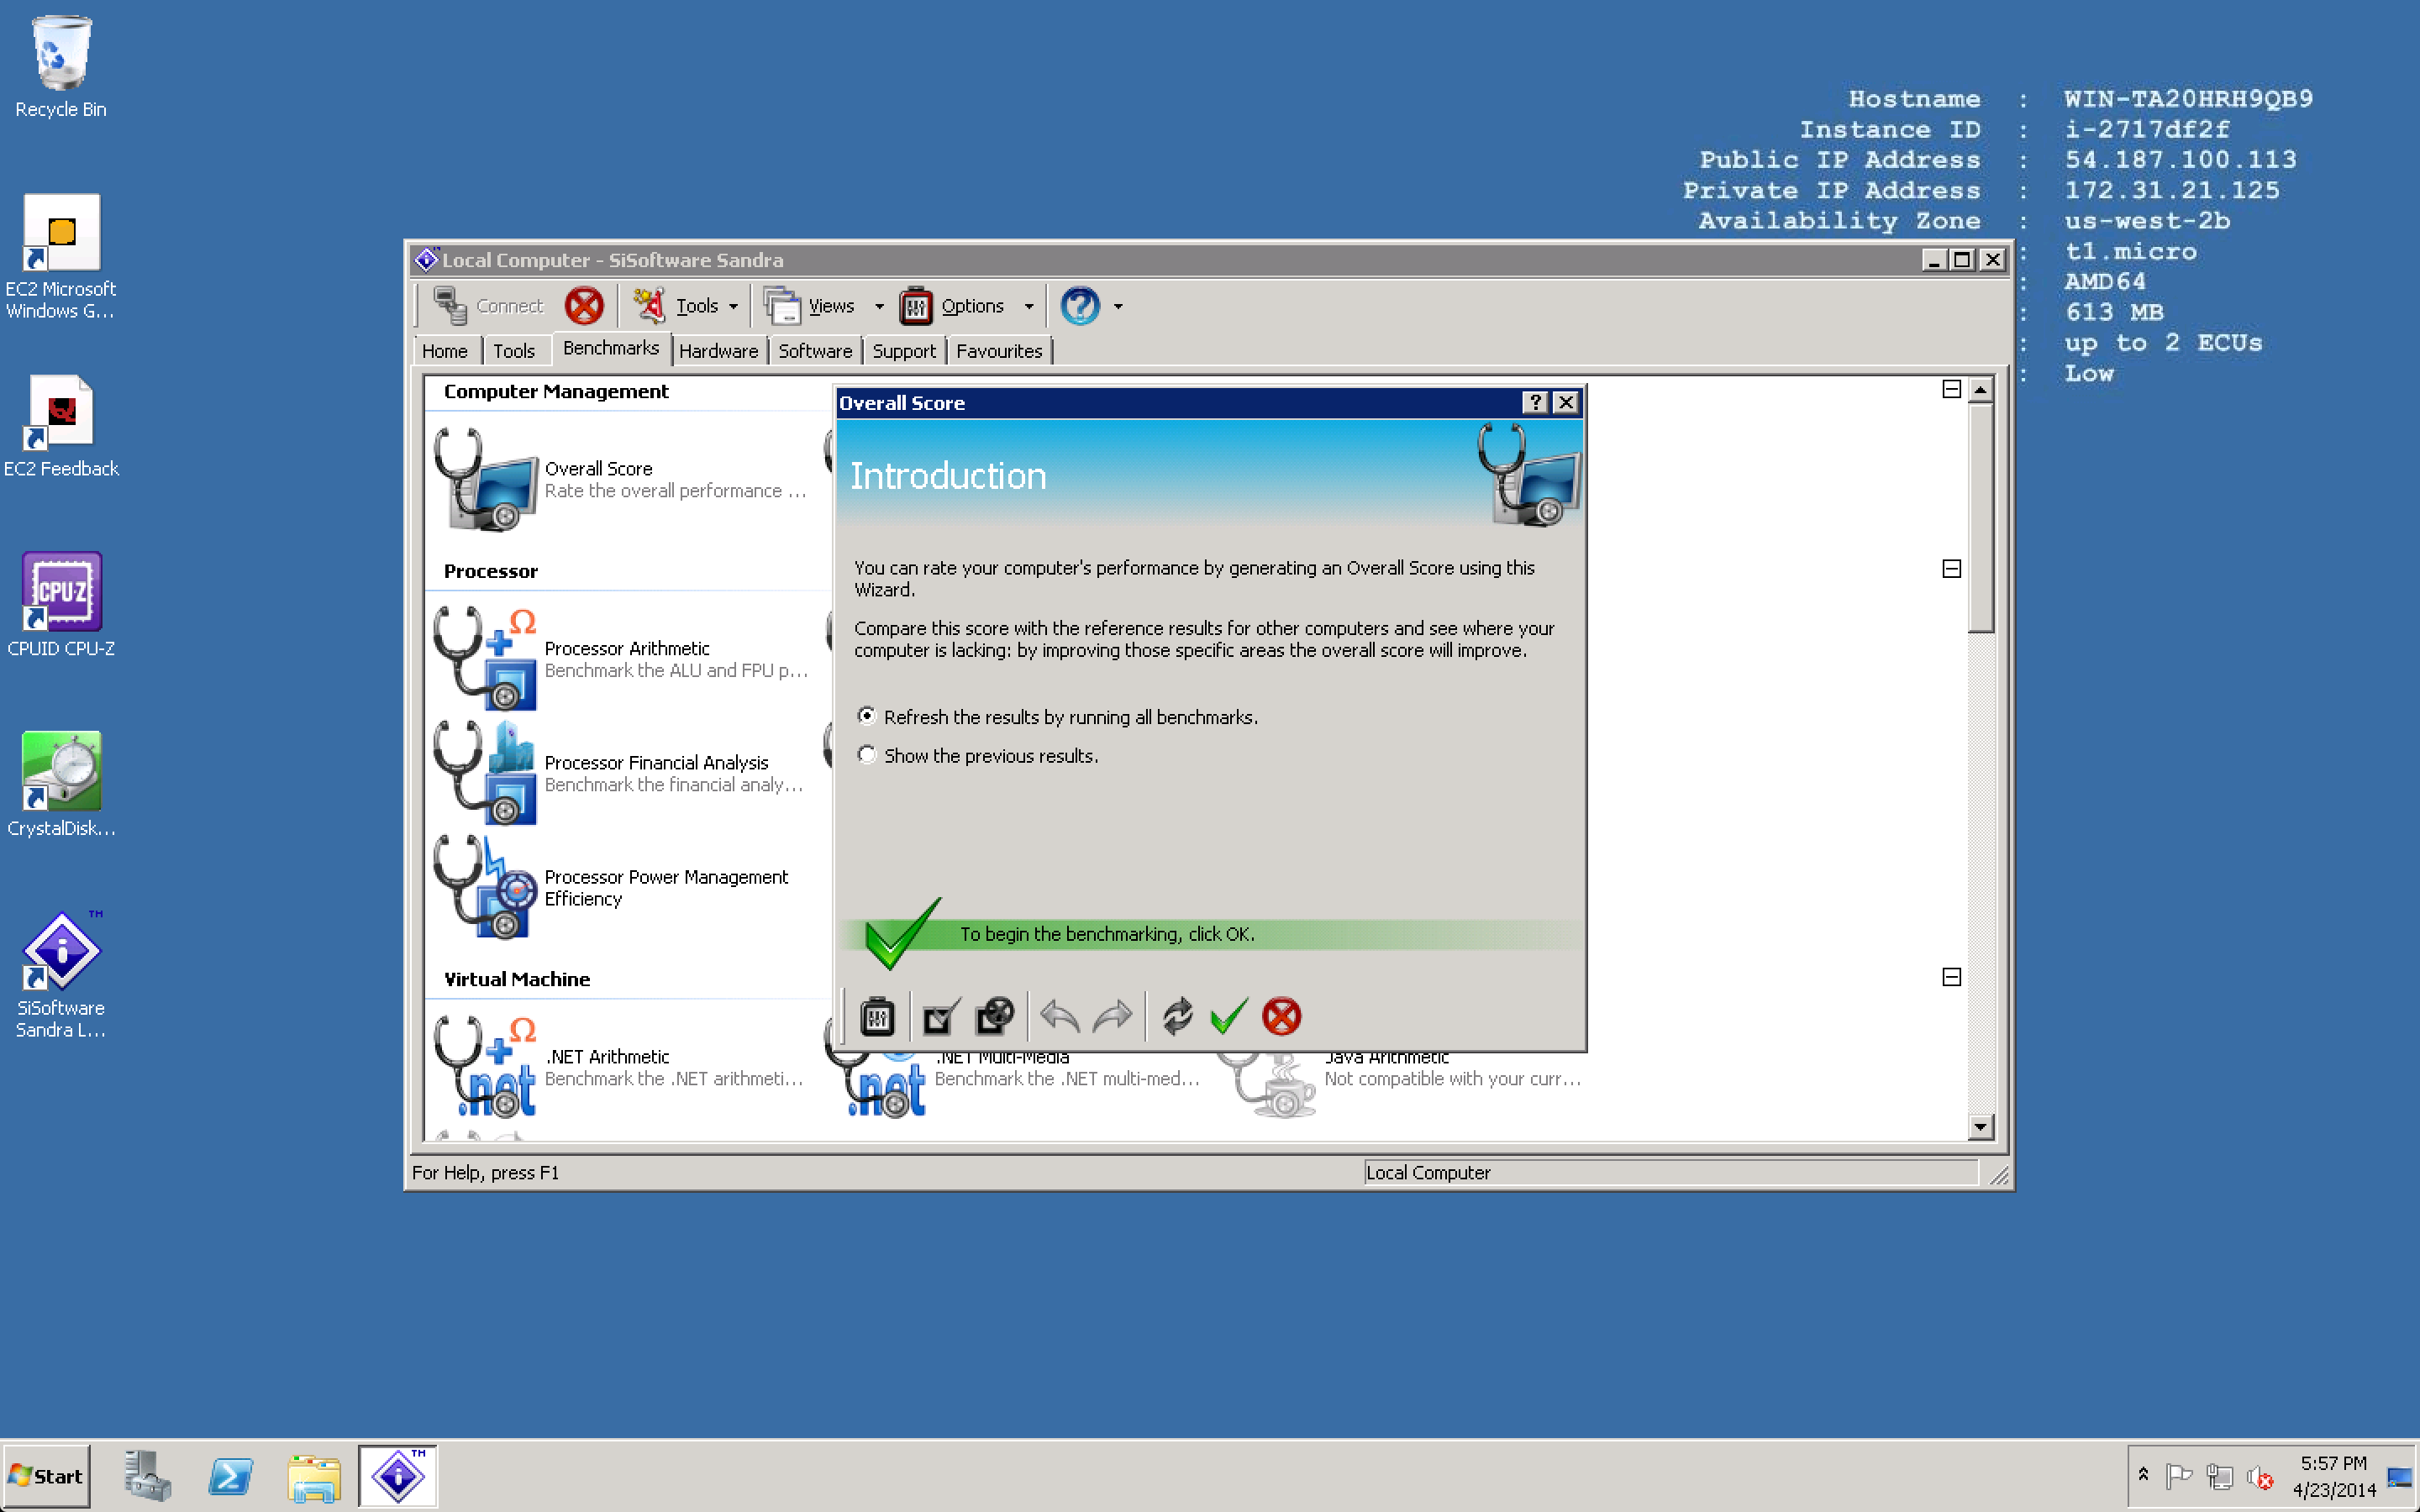
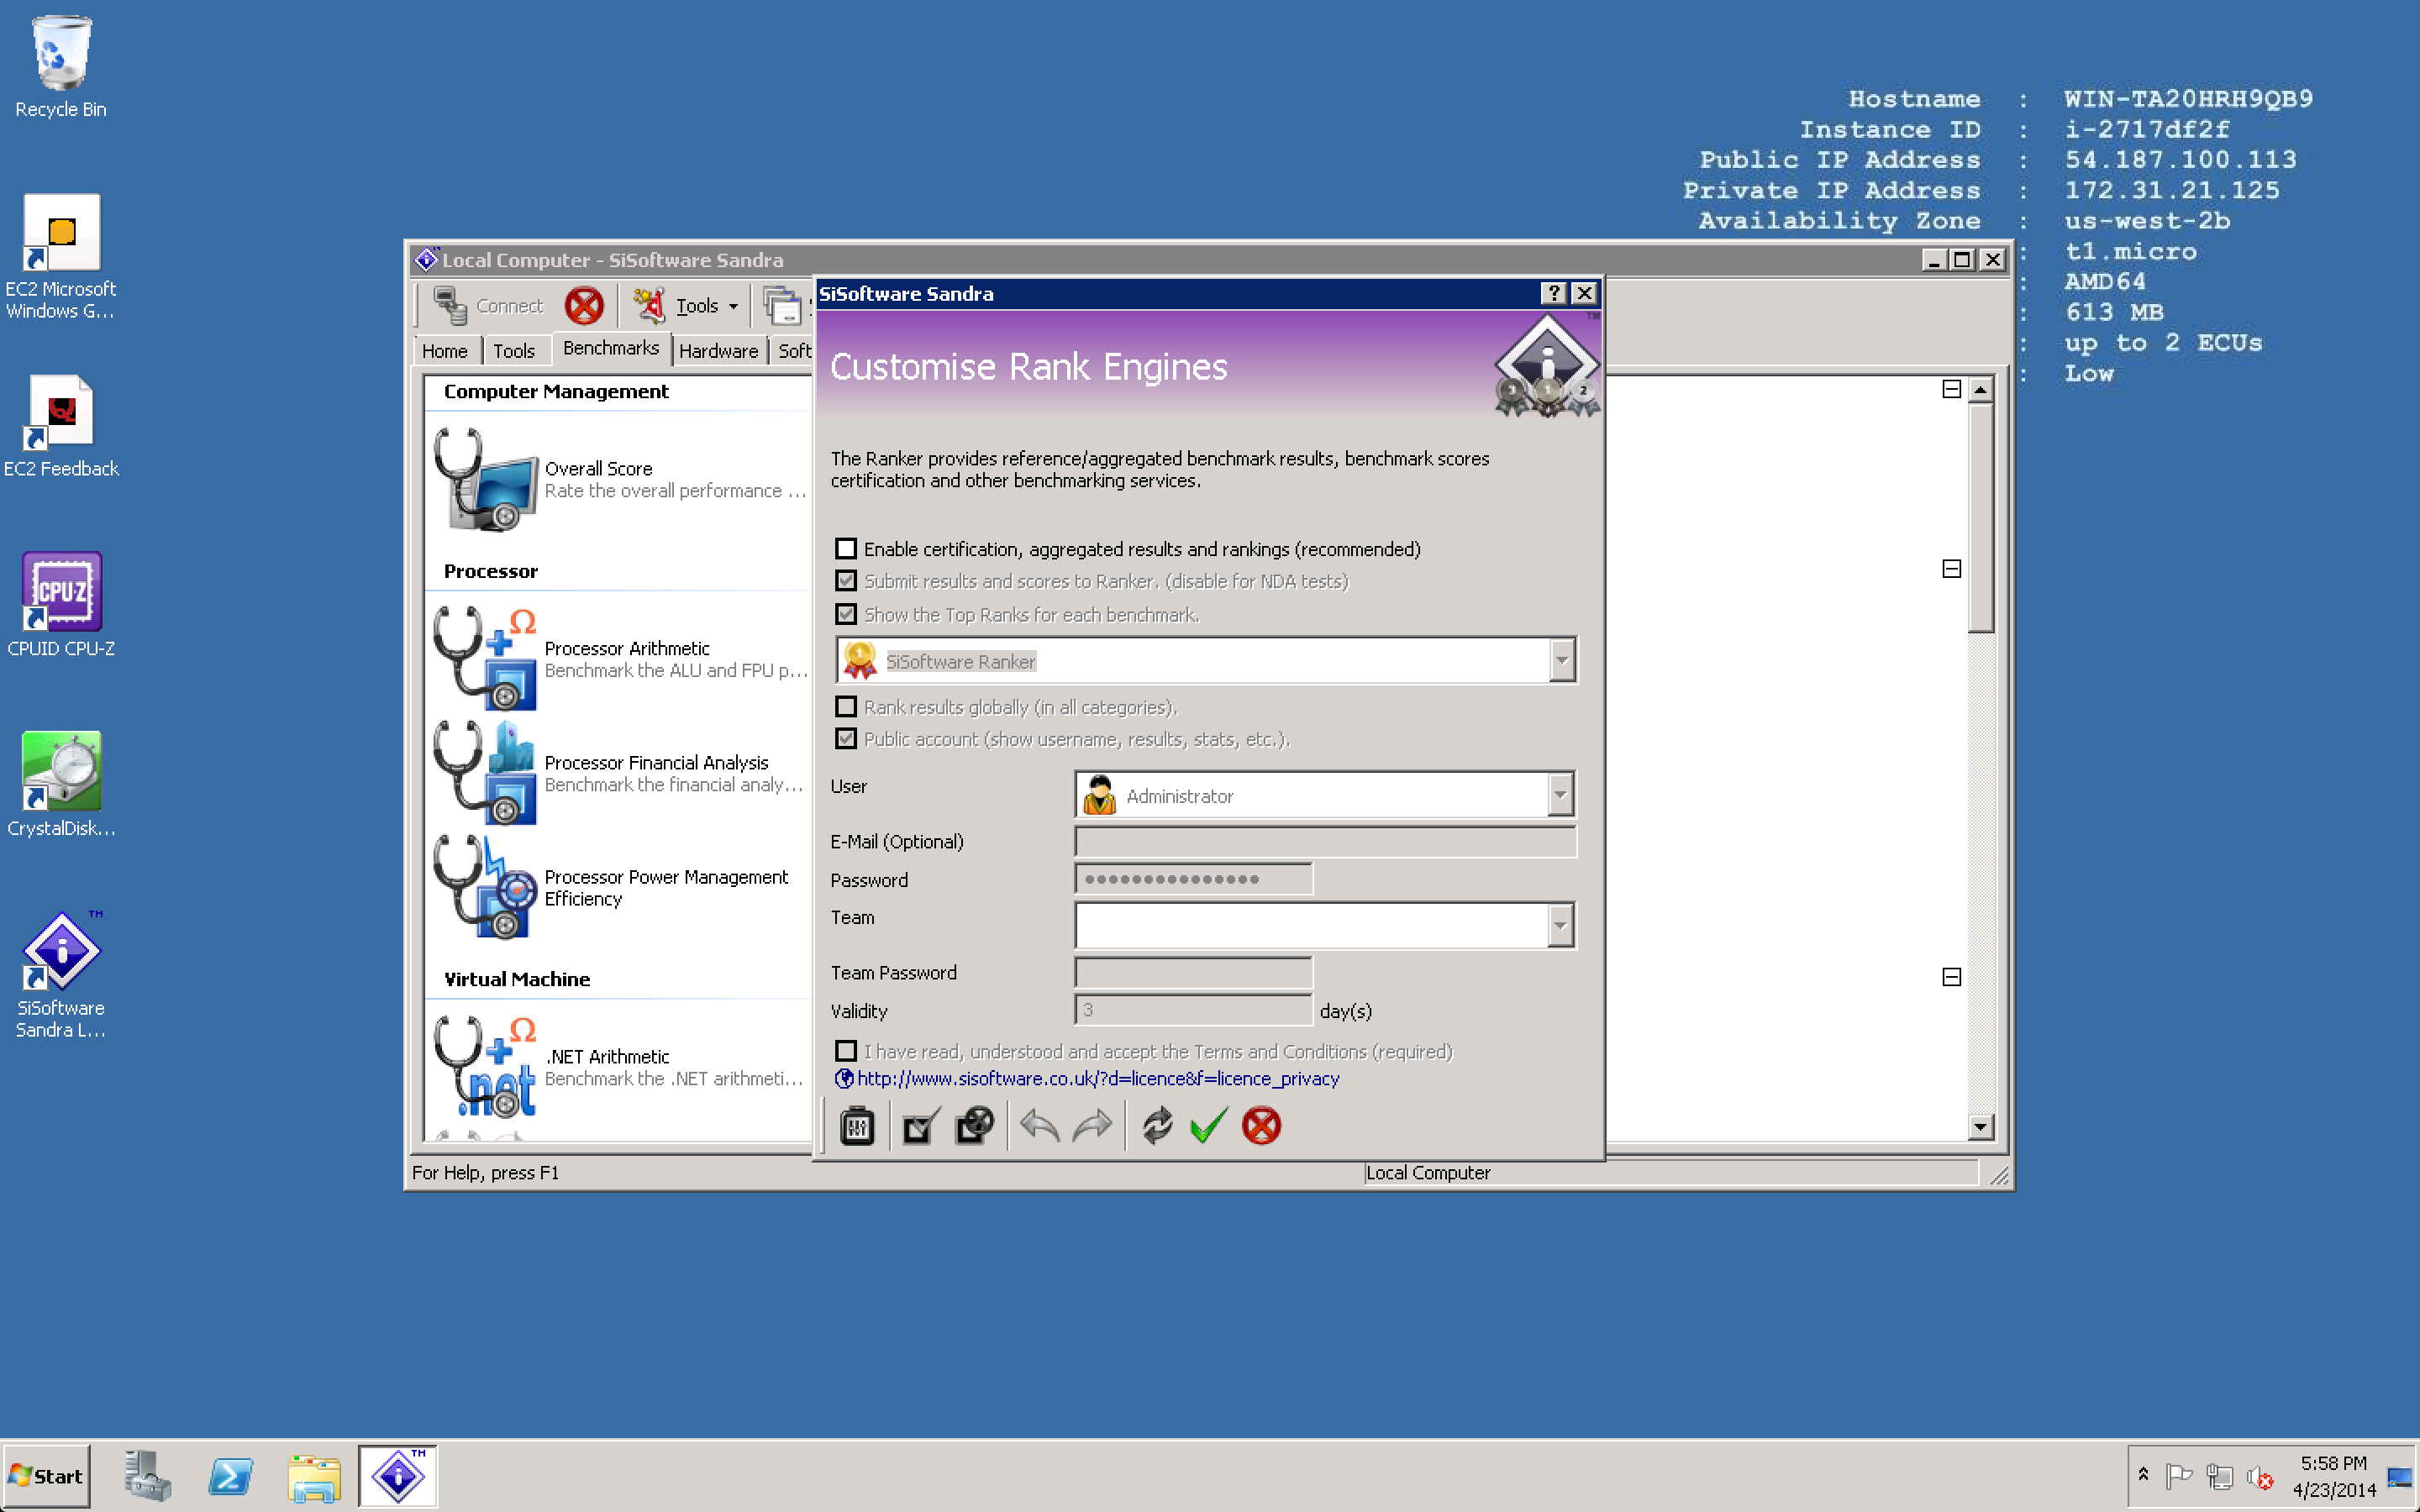
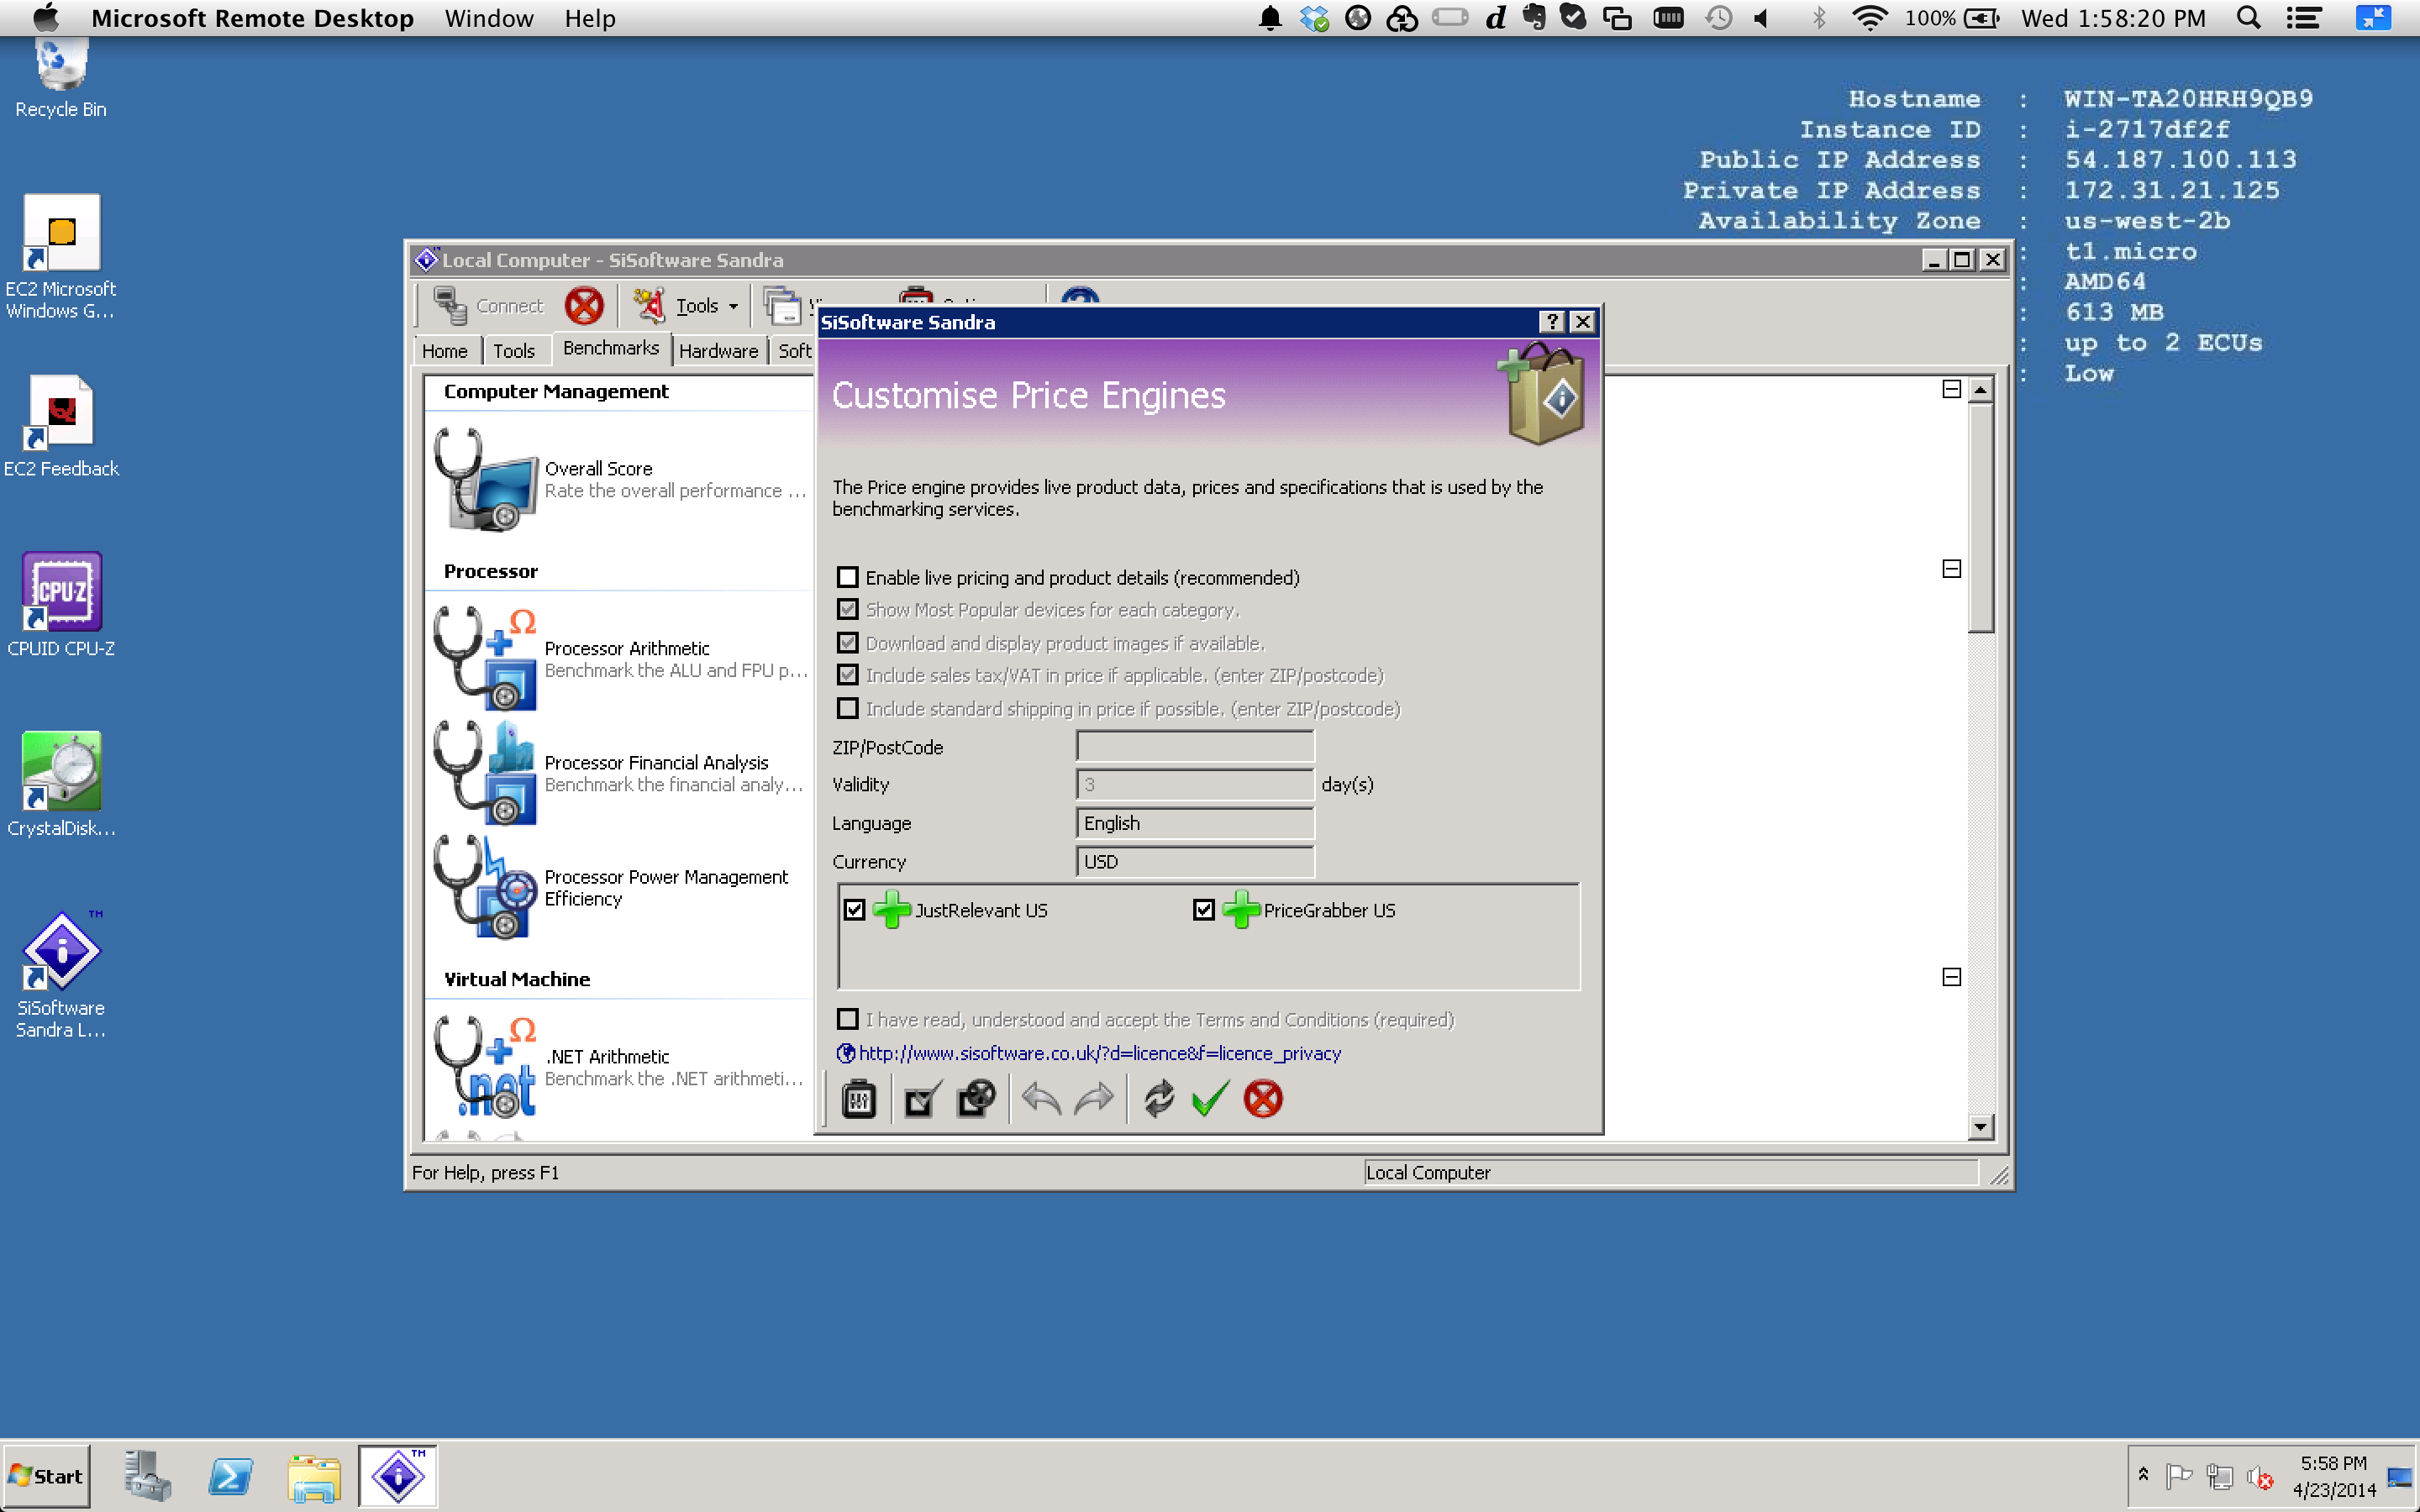
First up is the full test catalogue available on the Benchmarks tab. Next up, since this is the first run, we are going to “refresh the results”. Next is the option to participate in the public ranking system. I am disabling this for these tests. Finally is the option to participate in the device pricing engine run by the benchmark service. Again, I disable this for these tests. The Sandra suite is very comprehensive so I have included the full results below, but here is a snapshot of the vCHS summary screen:
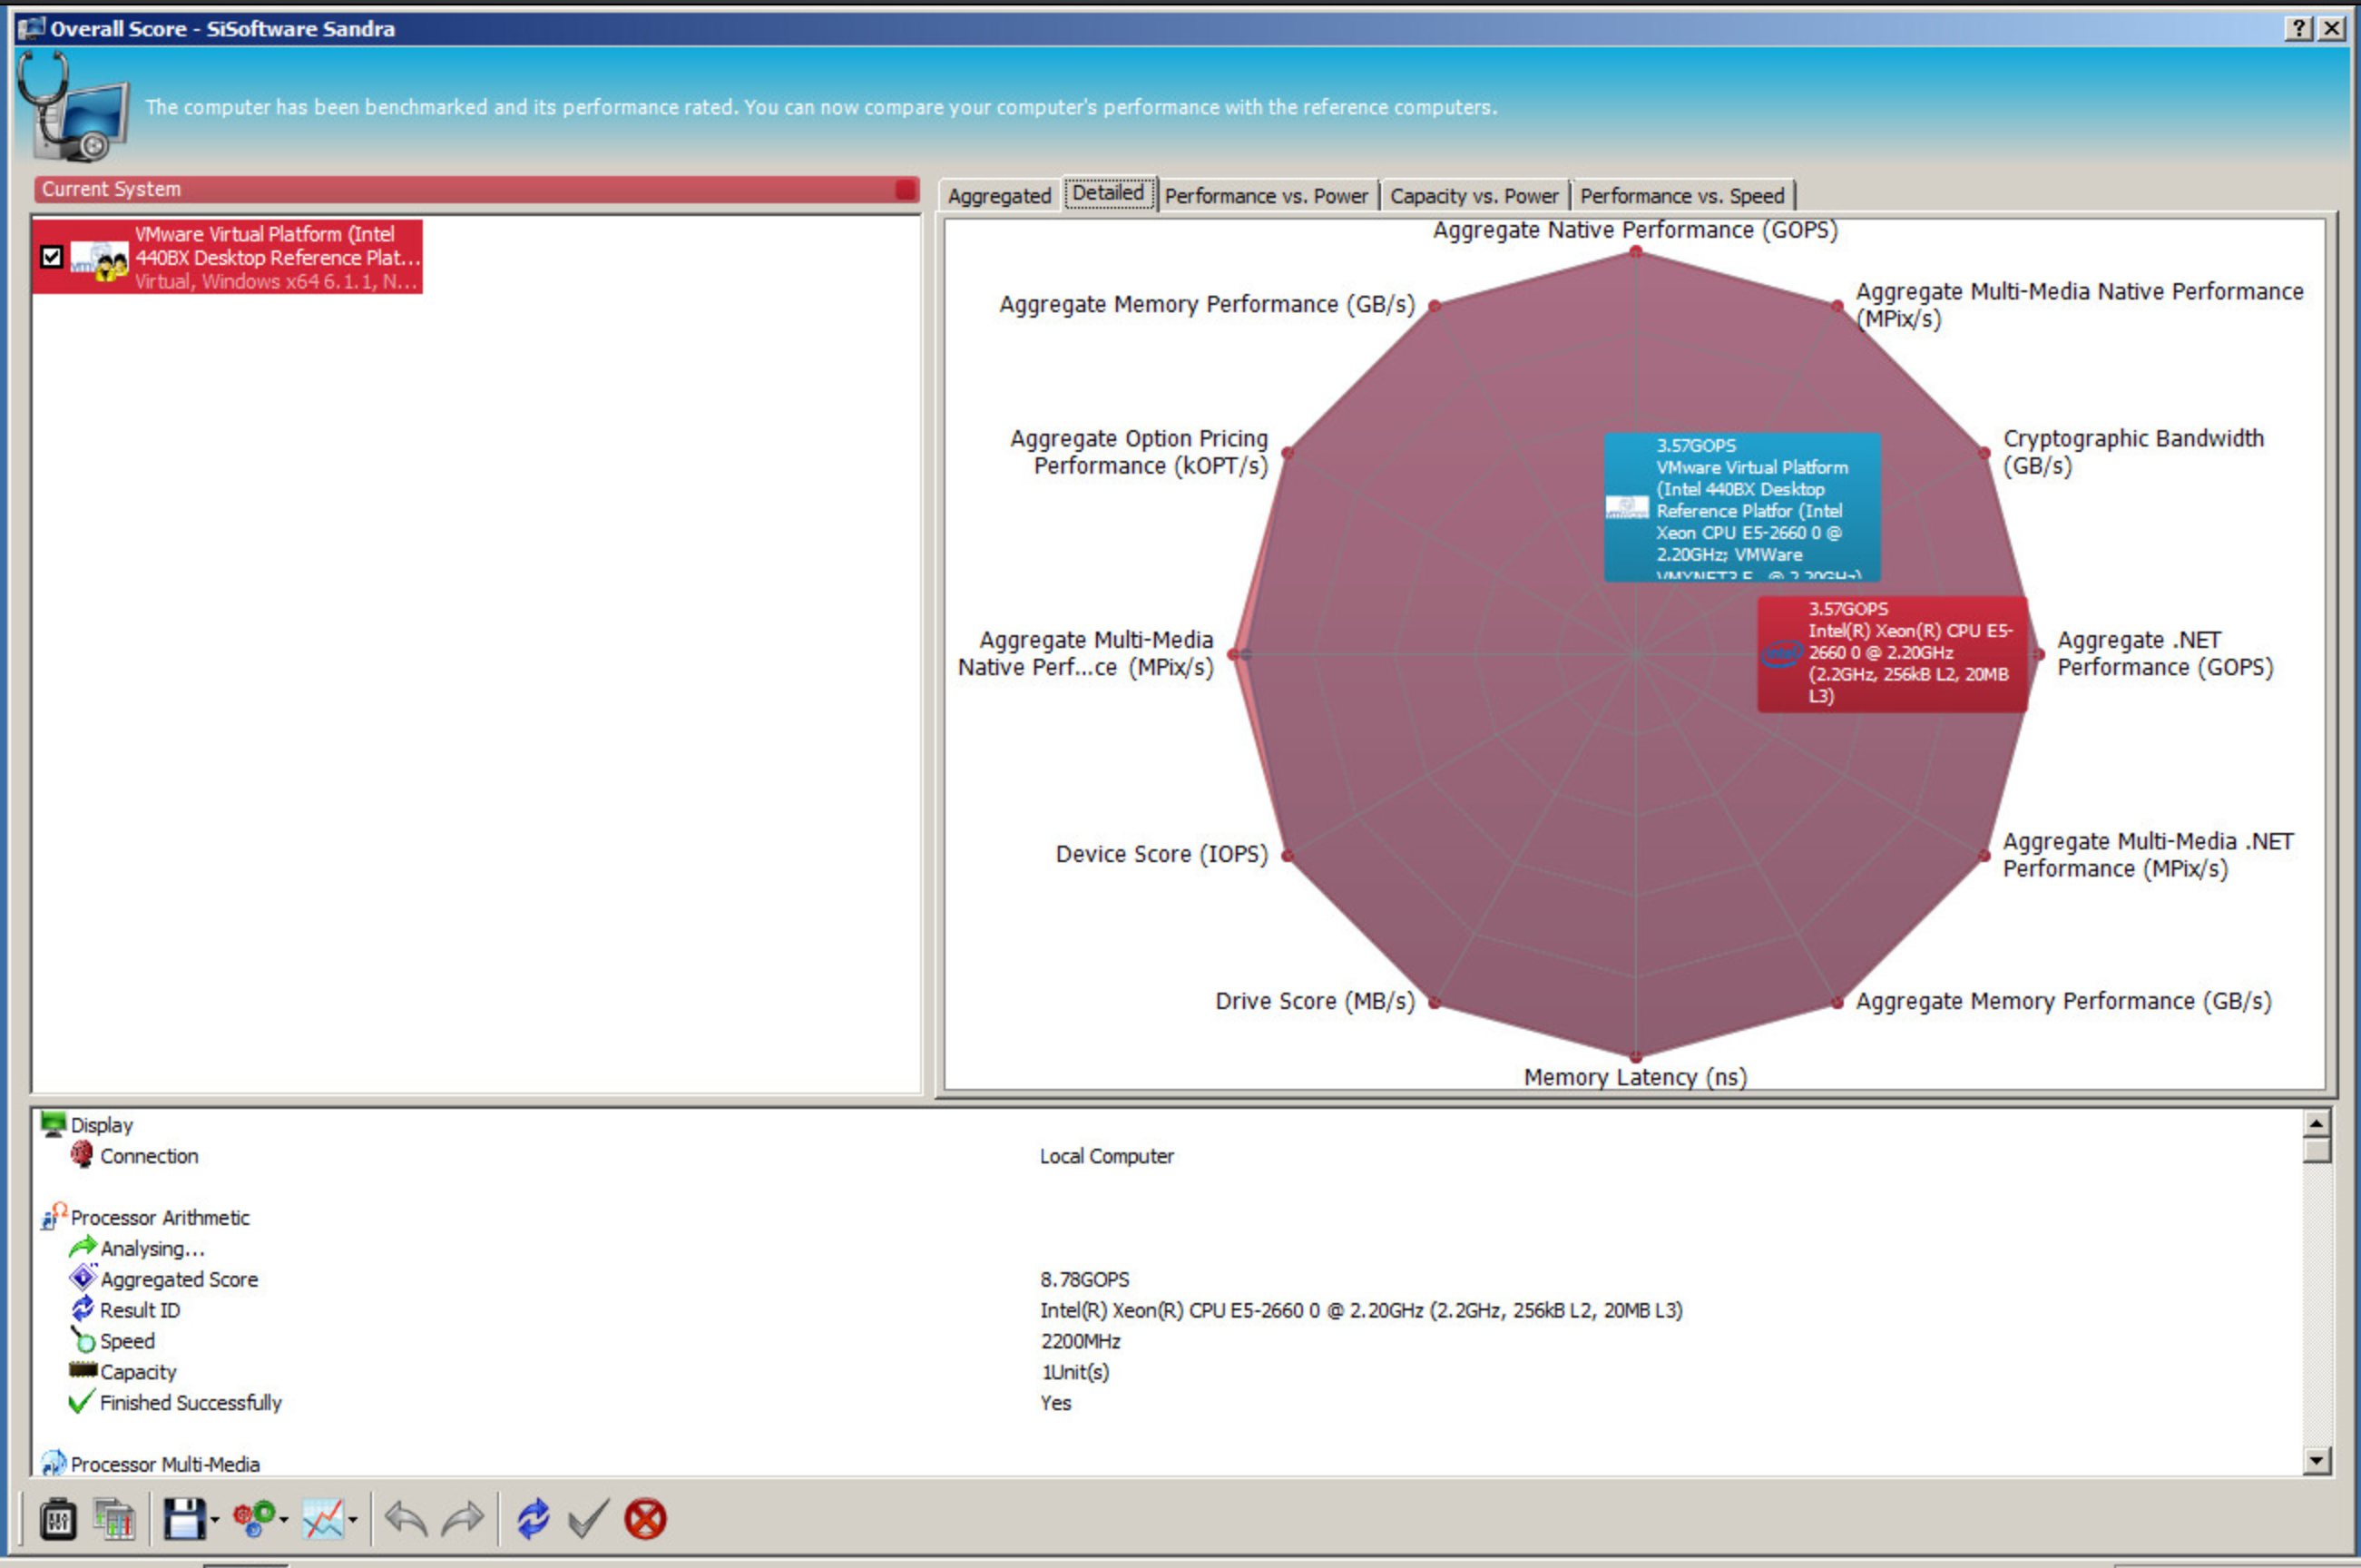
And the full results:
SiSoftware Sandra
Display
 Connection : Local Computer
Processor Arithmetic
 Analysing...
 Aggregated Score : 8.78GOPS
 Result ID : Intel(R) Xeon(R) CPU E5-2660 0 @ 2.20GHz (2.2GHz, 256kB L2, 20MB L3)
 Speed : 2200MHz
 Capacity : 1Unit(s)
 Finished Successfully : Yes
Processor Multi-Media
 Analysing...
 Aggregated Score : 18.68MPix/s
 Result ID : Intel(R) Xeon(R) CPU E5-2660 0 @ 2.20GHz (2.2GHz, 256kB L2, 20MB L3)
 Speed : 2200MHz
 Capacity : 1Unit(s)
 Finished Successfully : Yes
Cryptography
 Analysing...
 Aggregated Score : 0.602GB/s
 Result ID : Intel(R) Xeon(R) CPU E5-2660 0 @ 2.20GHz (2.2GHz, 256kB L2, 20MB L3)
 Speed : 2200MHz
 Capacity : 1Unit(s)
 Finished Successfully : Yes
.NET Arithmetic
 Analysing...
 Aggregated Score : 3.57GOPS
 Result ID : Intel(R) Xeon(R) CPU E5-2660 0 @ 2.20GHz (2.2GHz, 256kB L2, 20MB L3)
 Speed : 2200MHz
 Capacity : 1Unit(s)
 Finished Successfully : Yes
.NET Multi-Media
 Analysing...
 Aggregated Score : 2.22MPix/s
 Result ID : Intel(R) Xeon(R) CPU E5-2660 0 @ 2.20GHz (2.2GHz, 256kB L2, 20MB L3)
 Speed : 2200MHz
 Capacity : 1Unit(s)
 Finished Successfully : Yes
Memory Bandwidth
 Analysing...
 Aggregated Score : 6.423GB/s
 Result ID : VMWare VMXNET3 Ethernet Adapter; 640MB EDO DIMM SDRAM
 Capacity : 640MB
 Finished Successfully : Yes
Cache & Memory Latency
 Analysing...
 Aggregated Score : 810.3ns
 Result ID : VMWare VMXNET3 Ethernet Adapter; 640MB EDO DIMM SDRAM
 Capacity : 640MB
 Finished Successfully : Yes
File System Bandwidth
 Analysing...
 Aggregated Score : 392.589MB/s
 Result ID : VMware Virtual disk (43GB, SASCSI, SCSI-2, 7200rpm)
 Speed : 7200rpm
 Capacity : 42.95GB
 Finished Successfully : Yes
File System I/O
 Analysing...
 Aggregated Score : 1178.7IOPS
 Result ID : VMware Virtual disk (43GB, SASCSI, SCSI-2, 7200rpm)
 Speed : 3000Mbps
 Capacity : 42950MB
 Finished Successfully : Yes
GP (GPU/CPU/APU) Processing
 Analysing...
 Error (339) : No devices found. : GP(GPU) call failed. Try another interface (e.g. OpenCL/ComputeShader/CUDA/etc.) or update video drivers.
 Finished Successfully : No
Video Shader Compute
 Analysing...
 Error (335) : DirectX 11 Device(s) : VMware SVGA 3D (8MB) : Display call failed. Try another interface or update video drivers.
 Error (335) : DirectX 10.1 Device(s) : VMware SVGA 3D (8MB) : Display call failed. Try another interface or update video drivers.
 Error (335) : DirectX 10 Device(s) : VMware SVGA 3D (8MB) : Display call failed. Try another interface or update video drivers.
 Error (335) : DirectX 9.3 Device(s) : VMware SVGA 3D (8MB) : Display call failed. Try another interface or update video drivers.
 Error (335) : OpenGL Device(s) : VMware SVGA 3D (8MB) : Display call failed. Try another interface or update video drivers.
 Finished Successfully : No
Processor Multi-Media
 Analysing...
 Aggregated Score : 19.12MPix/s
 Result ID : Intel(R) Xeon(R) CPU E5-2660 0 @ 2.20GHz (2.2GHz, 256kB L2, 20MB L3)
 Speed : 2200MHz
 Capacity : 1Unit(s)
 Finished Successfully : Yes
GP (GPU/CPU/APU) Financial Analysis
 Analysing...
 Error (339) : No devices found. : Floating-Point (Normal/Single Precision) : GP(GPU) call failed. Try another interface (e.g. OpenCL/ComputeShader/CUDA/etc.) or update video drivers.
 Finished Successfully : No
Processor Financial Analysis
 Analysing...
 Aggregated Score : 0.94kOPT/s
 Result ID : Intel(R) Xeon(R) CPU E5-2660 0 @ 2.20GHz (2.2GHz, 256kB L2, 20MB L3)
 Speed : 2200MHz
 Capacity : 1Unit(s)
 Finished Successfully : Yes
GP (GPU/CPU/APU) Bandwidth
 Analysing...
 Error (339) : No devices found. : GP(GPU) call failed. Try another interface (e.g. OpenCL/ComputeShader/CUDA/etc.) or update video drivers.
 Finished Successfully : No
Video Memory Bandwidth
 Analysing...
 Error (334) : DirectX 11 Device(s) : VMware SVGA 3D (8MB) : Shader call failed. Try another interface (e.g. OpenGL) or update video drivers.
 Error (334) : DirectX 10.1 Device(s) : VMware SVGA 3D (8MB) : Shader call failed. Try another interface (e.g. OpenGL) or update video drivers.
 Error (334) : DirectX 10 Device(s) : VMware SVGA 3D (8MB) : Shader call failed. Try another interface (e.g. OpenGL) or update video drivers.
 Finished Successfully : No
Memory Bandwidth
 Analysing...
 Aggregated Score : 6.613GB/s
 Result ID : VMWare VMXNET3 Ethernet Adapter; 640MB EDO DIMM SDRAM
 Capacity : 640MB
 Finished Successfully : Yes
Overall Score
Aggregated Score : 0.83kPT
Results Interpretation : Higher Scores mean Better Performance.
Decimal Numeral System (base 10) : 1GPT = 1000MPT, 1MPT = 1000kPT, 1kPT = 1000PT, etc.
Result ID : VMware Virtual Platform (Intel 440BX Desktop Reference Platfor (Intel Xeon CPU E5-2660 0 @ 2.20GHz; VMWare VMXNET3 Ethernet Adapter; 640MB EDO DIMM SDRAM; VMware Virtual disk; Intel Xeon CPU E5-2660 0 @ 2.20GHz)
Finished Successfully : Yes
Next up is the EC2 result set. Once again, screenshot first:

And the results:
SiSoftware Sandra
Display
Connection : Local Computer
Processor Arithmetic
Analysing...
Aggregated Score : 1.72GOPS
Result ID : Intel(R) Xeon(R) CPU E5-2650 0 @ 2.00GHz (1.8GHz/2GHz, 1.8GHz IMC, 256kB L2, 20MB L3)
Speed : 1796MHz
Capacity : 1Unit(s)
Power : 95.00W
Finished Successfully : Yes
Processor Multi-Media
Analysing...
Aggregated Score : 3.68MPix/s
Result ID : Intel(R) Xeon(R) CPU E5-2650 0 @ 2.00GHz (1.8GHz/2GHz, 1.8GHz IMC, 256kB L2, 20MB L3)
Speed : 1796MHz
Capacity : 1Unit(s)
Power : 95.00W
Finished Successfully : Yes
Cryptography
Analysing...
Aggregated Score : 0.027GB/s
Result ID : Intel(R) Xeon(R) CPU E5-2650 0 @ 2.00GHz (1.8GHz/2GHz, 1.8GHz IMC, 256kB L2, 20MB L3)
Speed : 1796MHz
Capacity : 1Unit(s)
Power : 95.00W
Finished Successfully : Yes
.NET Arithmetic
Analysing...
Aggregated Score : 1.76GOPS
Result ID : Intel(R) Xeon(R) CPU E5-2650 0 @ 2.00GHz (1.8GHz/2GHz, 1.8GHz IMC, 256kB L2, 20MB L3)
Speed : 1796MHz
Capacity : 1Unit(s)
Power : 95.00W
Finished Successfully : Yes
.NET Multi-Media
Analysing...
Aggregated Score : 0.42MPix/s
Result ID : Intel(R) Xeon(R) CPU E5-2650 0 @ 2.00GHz (1.8GHz/2GHz, 1.8GHz IMC, 256kB L2, 20MB L3)
Speed : 1796MHz
Capacity : 1Unit(s)
Power : 95.00W
Finished Successfully : Yes
Memory Bandwidth
Analysing...
Aggregated Score : 1.030GB/s
Result ID : XenSource Xen Platform Device; 615MB DIMM
Capacity : 615MB
Finished Successfully : Yes
Cache & Memory Latency
Analysing...
Aggregated Score : 979.1ns
Result ID : XenSource Xen Platform Device; 615MB DIMM
Capacity : 615MB
Finished Successfully : Yes
File System Bandwidth
Analysing...
Aggregated Score : 77.998MB/s
Result ID : XENSRC PVDISK (32.2GB, SCSI, SCSI-4)
Speed : 10000rpm
Capacity : 32.21GB
Finished Successfully : Yes
File System I/O
Analysing...
Aggregated Score : 790.9IOPS
Result ID : XENSRC PVDISK (32.2GB, SCSI, SCSI-4)
Speed : 2560Mbps
Capacity : 32212MB
Finished Successfully : Yes
GP (GPU/CPU/APU) Processing
Analysing...
Error (339) : No devices found. : GP(GPU) call failed. Try another interface (e.g. OpenCL/ComputeShader/CUDA/etc.) or update video drivers.
Finished Successfully : No
Video Shader Compute
Analysing...
Error (335) : DirectX 11 Device(s) : RDPDD Chained DD : Display call failed. Try another interface or update video drivers.
Error (335) : DirectX 10.1 Device(s) : RDPDD Chained DD : Display call failed. Try another interface or update video drivers.
Error (335) : DirectX 10 Device(s) : RDPDD Chained DD : Display call failed. Try another interface or update video drivers.
Error (335) : DirectX 9.3 Device(s) : RDPDD Chained DD : Display call failed. Try another interface or update video drivers.
Error (335) : OpenGL Device(s) : RDPDD Chained DD : Display call failed. Try another interface or update video drivers.
Finished Successfully : No
Processor Multi-Media
Analysing...
Aggregated Score : 3.16MPix/s
Result ID : Intel(R) Xeon(R) CPU E5-2650 0 @ 2.00GHz (1.8GHz/2GHz, 1.8GHz IMC, 256kB L2, 20MB L3)
Speed : 1796MHz
Capacity : 1Unit(s)
Power : 95.00W
Finished Successfully : Yes
GP (GPU/CPU/APU) Financial Analysis
Analysing...
Error (339) : No devices found. : Floating-Point (Normal/Single Precision) : GP(GPU) call failed. Try another interface (e.g. OpenCL/ComputeShader/CUDA/etc.) or update video drivers.
Finished Successfully : No
Processor Financial Analysis
Analysing...
Aggregated Score : 0.29kOPT/s
Result ID : Intel(R) Xeon(R) CPU E5-2650 0 @ 2.00GHz (1.8GHz/2GHz, 1.8GHz IMC, 256kB L2, 20MB L3)
Speed : 1796MHz
Capacity : 1Unit(s)
Power : 95.00W
Finished Successfully : Yes
GP (GPU/CPU/APU) Bandwidth
Analysing...
Error (339) : No devices found. : GP(GPU) call failed. Try another interface (e.g. OpenCL/ComputeShader/CUDA/etc.) or update video drivers.
Finished Successfully : No
Video Memory Bandwidth
Analysing...
Error (334) : DirectX 11 Device(s) : RDPDD Chained DD : Shader call failed. Try another interface (e.g. OpenGL) or update video drivers.
Error (334) : DirectX 10.1 Device(s) : RDPDD Chained DD : Shader call failed. Try another interface (e.g. OpenGL) or update video drivers.
Error (334) : DirectX 10 Device(s) : RDPDD Chained DD : Shader call failed. Try another interface (e.g. OpenGL) or update video drivers.
Finished Successfully : No
Memory Bandwidth
Analysing...
Aggregated Score : 4.622GB/s
Result ID : XenSource Xen Platform Device; 615MB DIMM
Capacity : 615MB
Finished Successfully : Yes
Overall Score
Aggregated Score : 0.22kPT
Results Interpretation : Higher Scores mean Better Performance.
Decimal Numeral System (base 10) : 1GPT = 1000MPT, 1MPT = 1000kPT, 1kPT = 1000PT, etc.
Result ID : Xen HVM domU (Intel Xeon CPU E5-2650 0 @ 2.00GHz; XenSource Xen Platform Device; 615MB DIMM; XENSRC PVDISK; Intel Xeon CPU E5-2650 0 @ 2.00GHz)
Finished Successfully : Yes
Holy smokes! Another huge slam dunk for vCHS! Look at that aggregated score difference – .83kPT for vCHS vs .22kPT for the EC2 t1.micro. That’s a nearly 4x increase in performance for vCHS. It seems like the 1.8Ghz virtual Sandy EX core in the t1.micro is underperforming and the 2.1Ghz virtual Sandy EX in vCHS is over performing. This overall result is clearly reflected in each of the discrete CPU tests where we see consistent advantages for vCHS. This result was really interesting and will be even more interesting to see in the context of other CPU benchmarks.
Looking at memory we see a similar trend. 4.6GB/s for EC2 vs 6.6GB/s for vCHS – a 50% advantage to vCHS.
Storage matches what we saw in CrystalMark with 790IOPs for EBS being bested by over 1100IOPs for vCHS – another 50% advantage to vCHS.
WINNER: vCHS
DaCapo 9.12 Java Benchmark Suite Results
DaCapo Benchmarking Project is an open source suite of Java based benchmarks, shipped in a 167MB monolithic JAR, that aims to provide a level performance measurement across platforms. It is particularly useful in benchmarking cloud instances since pretty much anything can run Java. The suite consists of a series of 14 tests:
avrora |
simulates a number of programs run on a grid of AVR microcontrollers |
batik |
produces a number of Scalable Vector Graphics (SVG) images based on the unit tests in Apache Batik |
eclipse |
executes some of the (non-gui) jdt performance tests for the Eclipse IDE |
fop |
takes an XSL-FO file, parses it and formats it, generating a PDF file. |
h2 |
executes a JDBCbench-like in-memory benchmark, executing a number of transactions against a model of a banking application, replacing the hsqldb benchmark |
jython |
inteprets a the pybench Python benchmark |
luindex |
Uses lucene to indexes a set of documents; the works of Shakespeare and the King James Bible |
lusearch |
Uses lucene to do a text search of keywords over a corpus of data comprising the works of Shakespeare and the King James Bible |
pmd |
analyzes a set of Java classes for a range of source code problems |
sunflow |
renders a set of images using ray tracing |
tomcat |
runs a set of queries against a Tomcat server retrieving and verifying the resulting webpages |
tradebeans |
runs the daytrader benchmark via a Jave Beans to a GERONIMO backend with an in memory h2 as the underlying database |
tradesoap |
runs the daytrader benchmark via a SOAP to a GERONIMO backend with in memory h2 as the underlying database |
xalan |
transforms XML documents into HTML |
For my testing I ended up with a subset. The tests I excluded threw Java exceptions that I wasn’t in the mood to troubleshoot. I included a screenshot of one such exception below for reference though:
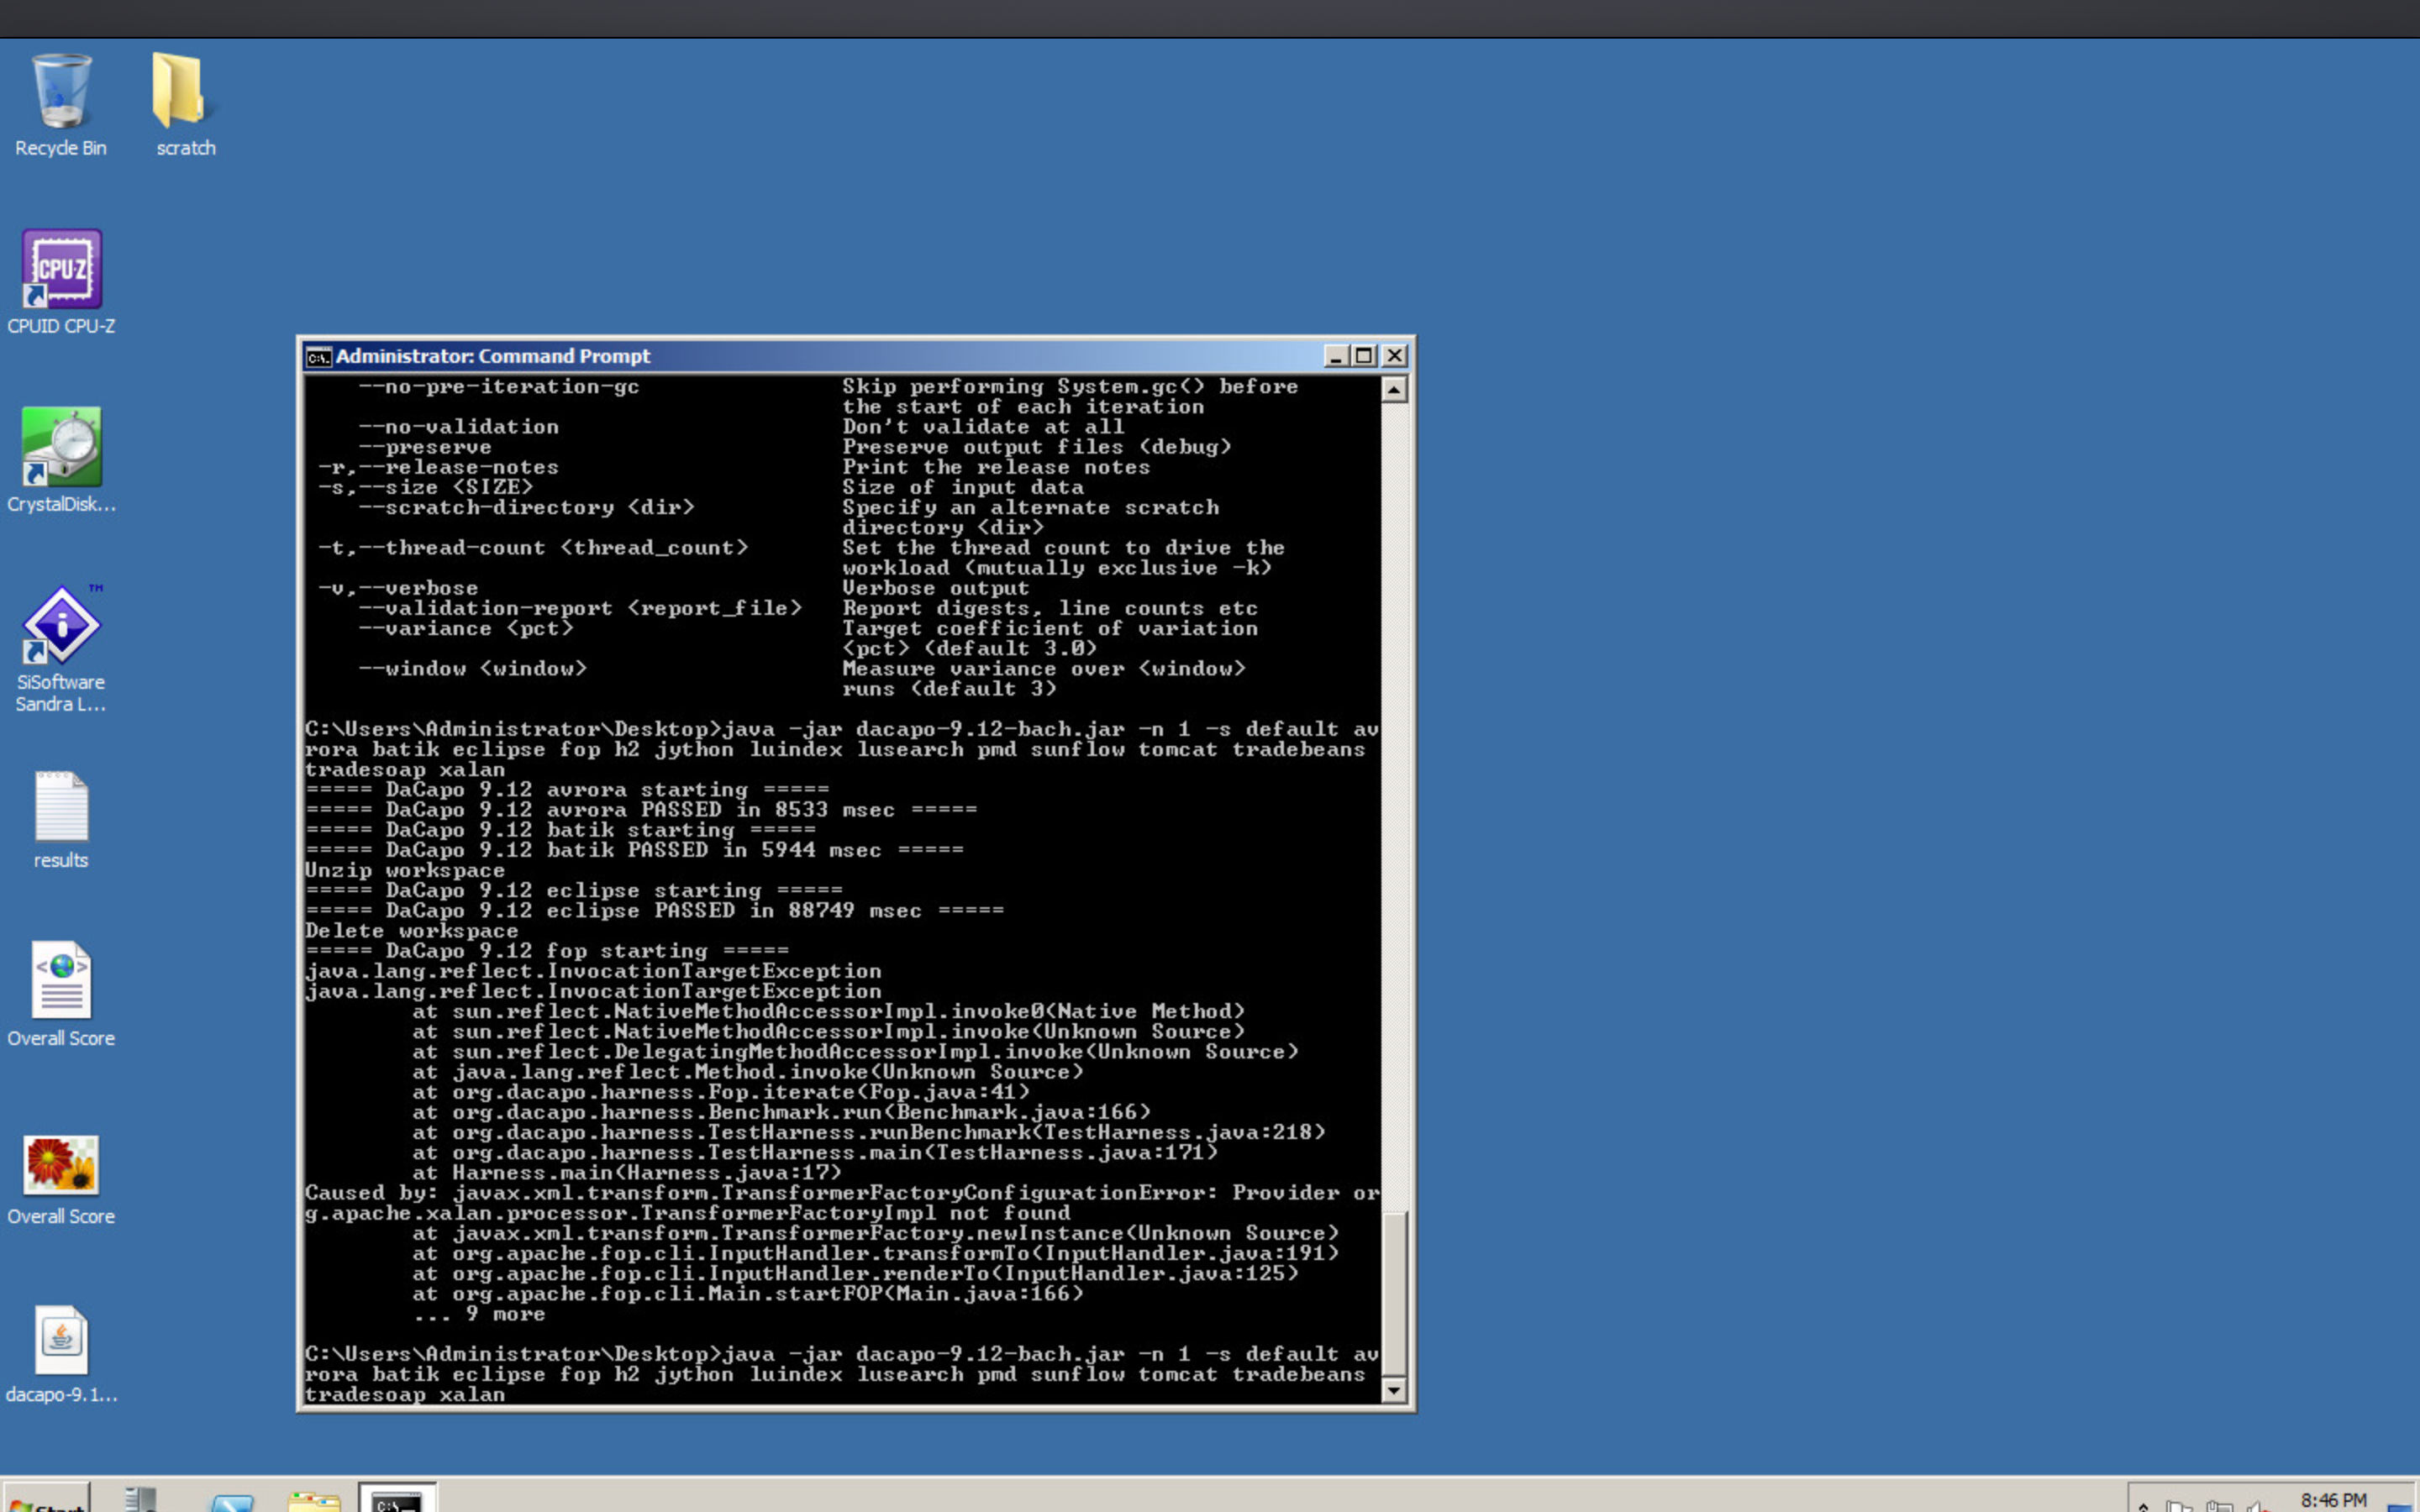
Here is the list of tests that ran correctly:
avrora |
simulates a number of programs run on a grid of AVR microcontrollers |
batik |
produces a number of Scalable Vector Graphics (SVG) images based on the unit tests in Apache Batik |
eclipse |
executes some of the (non-gui) jdt performance tests for the Eclipse IDE |
luindex |
Uses lucene to indexes a set of documents; the works of Shakespeare and the King James Bible |
lusearch |
Uses lucene to do a text search of keywords over a corpus of data comprising the works of Shakespeare and the King James Bible |
pmd |
analyzes a set of Java classes for a range of source code problems |
sunflow |
renders a set of images using ray tracing |
xalan |
transforms XML documents into HTML |
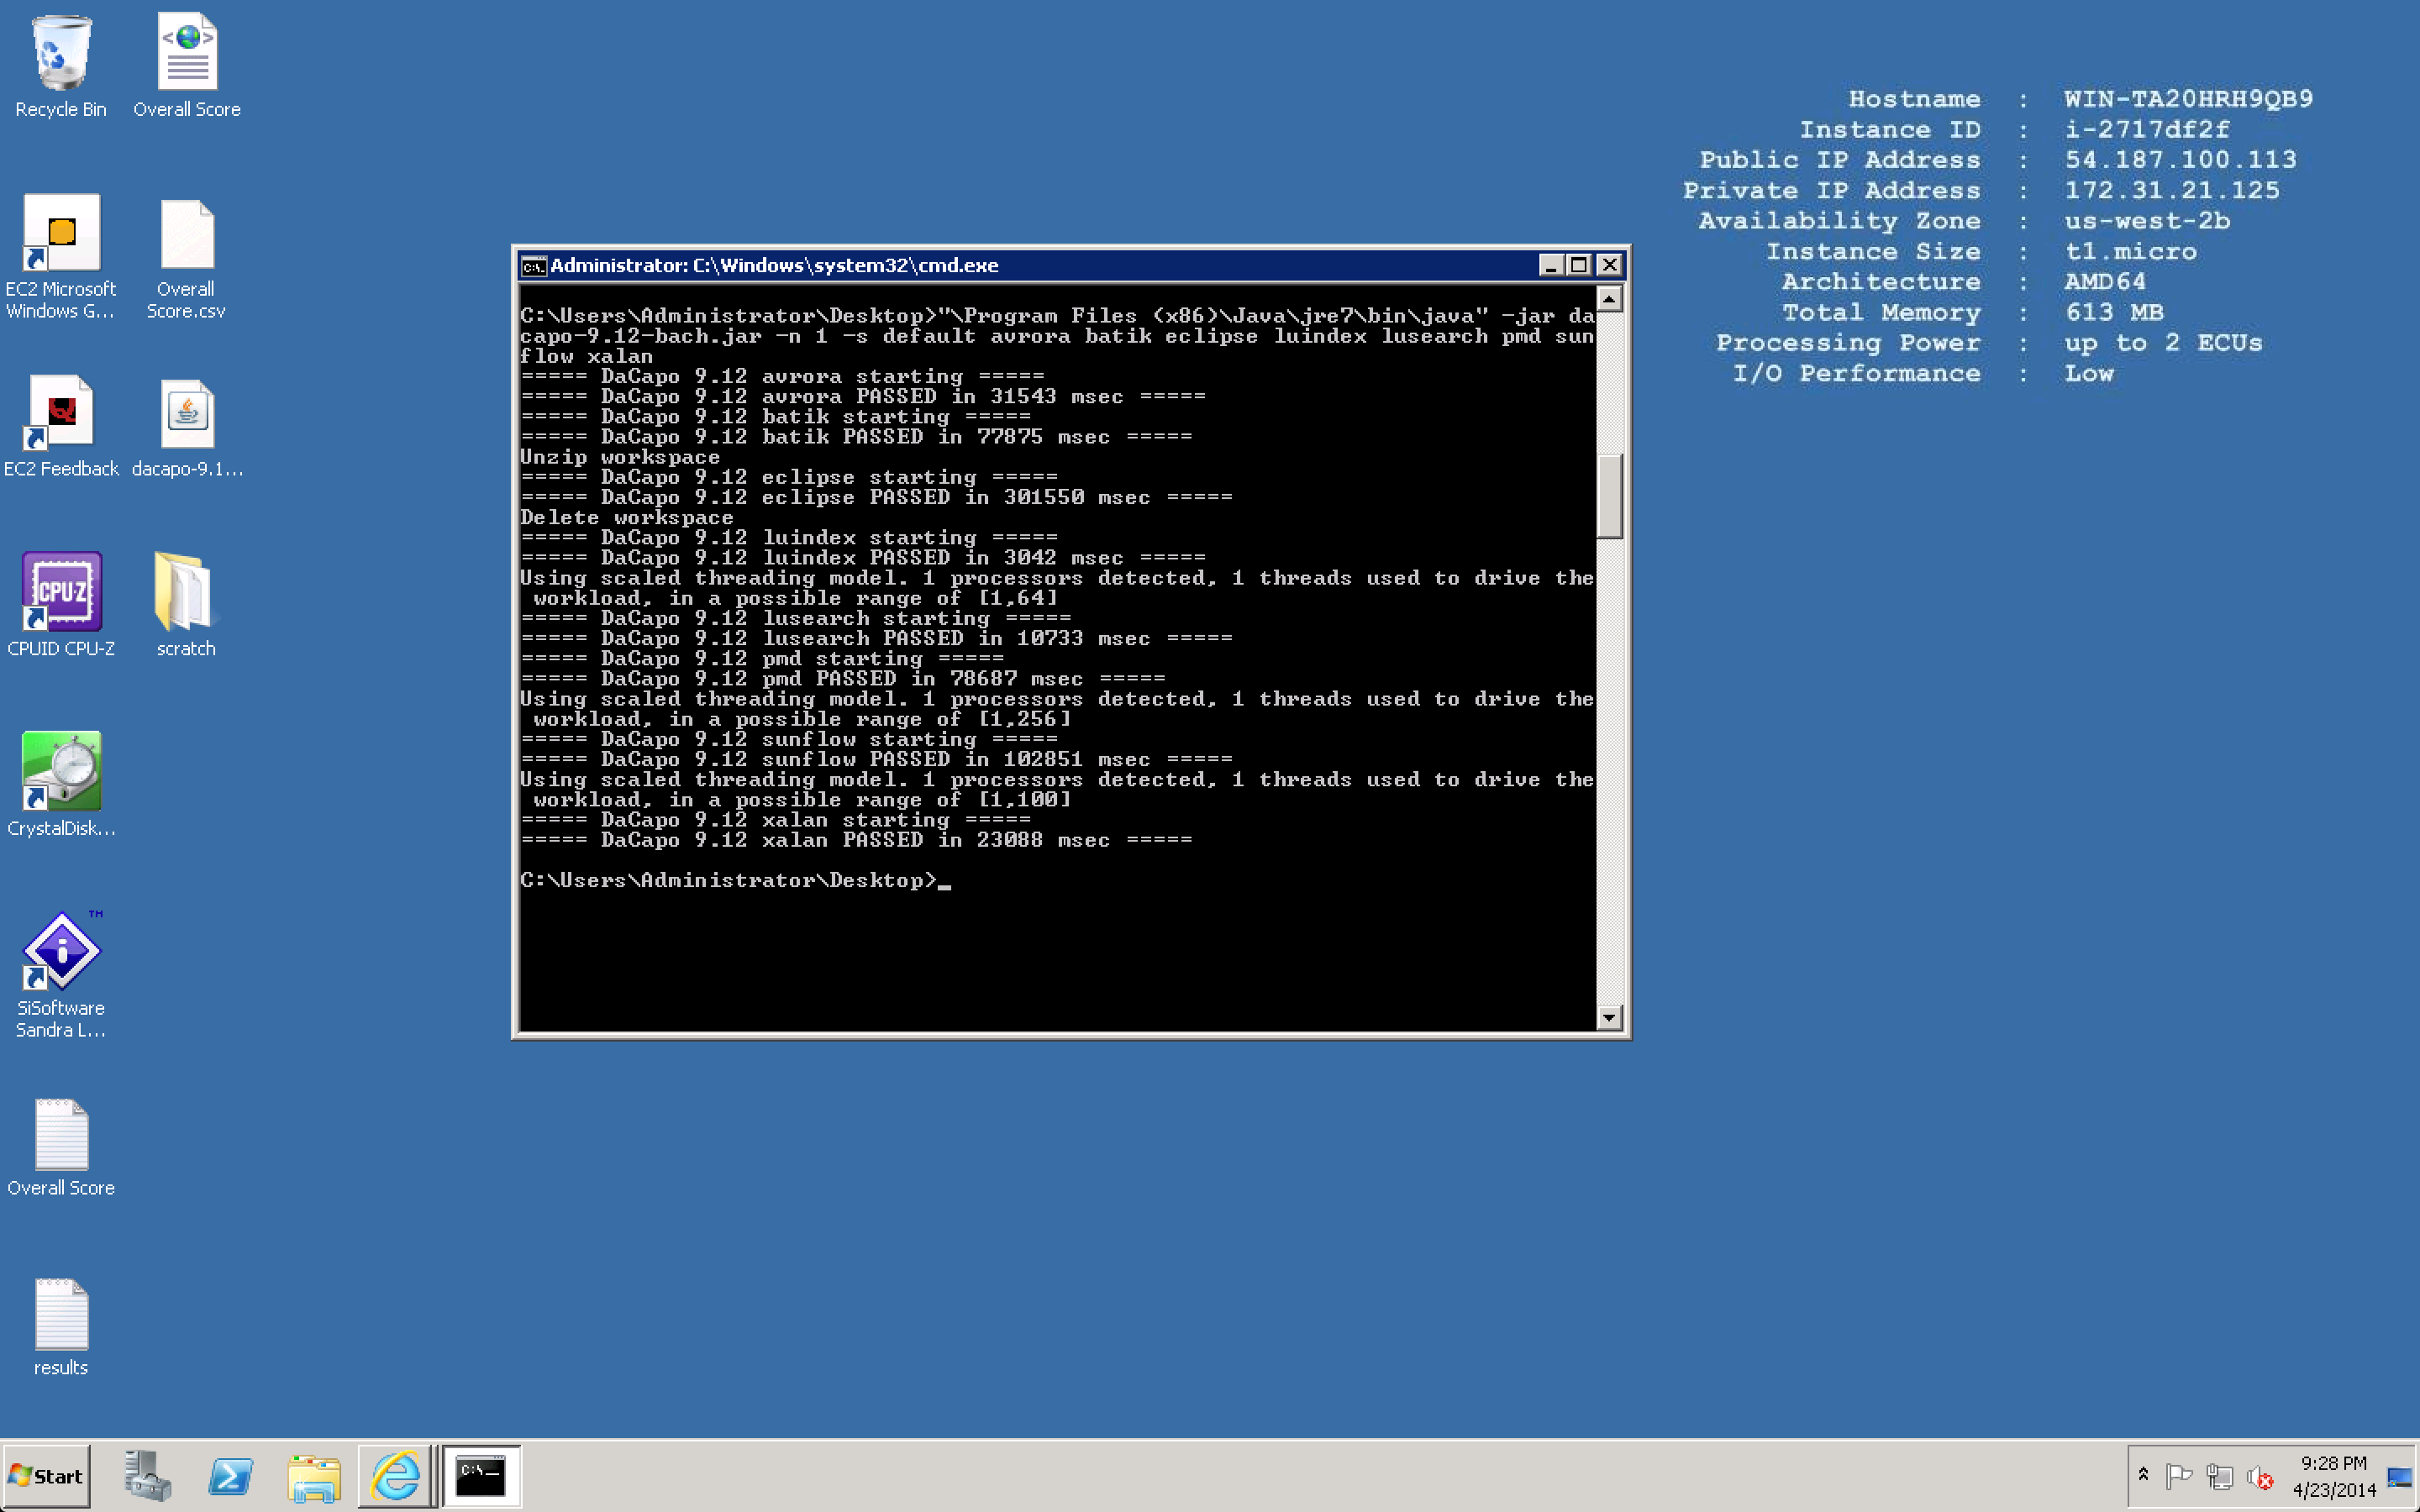
First up, the results for vCHS:

The total completion time for all tests came in at: 142320 msec. I also decided to add a cost dimension here. Keep in mind that this is a bit tricky since vCHS is based on a subscription cost for capacity, and in order to simulate the t1.micro we needed the capabilities of the Dedicated Cloud offering which provides dedicated host hardware. To try to level the cost playing field, I modeled the 2Ghz slice of the DC against a t1.micro dedicated 1 year RI with heavy util. What’s that you say? There is no such thing as a dedicated t1.micro? Yes, I know. To account for this I added the generalized 10% upcharge for dedicated instances to the t1.micro. Highly synthetic, yes, but it does seem reasonable for our purposes here.
In order to normalize the vCHS subscription aspect, I took the total monthly cost for a dedicated cloud (from the vCHS Public Site) and extrapolated the cost for a single second of compute time. Included in this calculation is compute, storage and support. I then multiplied the cost per second by the 142 seconds it took the vCHS VM to complete the suite. Here are the results:
|
Support |
0.024707562 |
| Storage | 0.000213657 |
| Compute | 0.001183333 |
| TOTAL COST |
0.026104552 |
So vCHS cost was $.026 to run the suite. Let’s take a look at EC2:
Holy smokes! 629369 msec for the t1.micro to complete the same test matrix. Wow! The EC2 cost advantage would have to be massive to offset that. Leaving aside that technically we are running on free tier (this is only good for a year anyhow), let’s take a look at what this test would have cost had we been paying for that t1.micro:
| Support | 0 |
| Storage | 0.000401042 |
| Compute | 0.001178819 |
| RI fee | 0.001255787 |
| TOTAL COST |
0.002835648 |
So the EC2 cost advantage is impressive in this scenario. Despite a massive performance deficit of nearly 4.5x, the cost advantage of a t1.micro actually does make up for it in terms of total cost for the test with the suite run time coming in at $.0028, a factor of 10x less. I did included the one time RI fee divided over the one year period in this calculation, and this was a 1 year heavy util RI which provides an excellent cost per hour, but then I also added an artificial “dedicated instance” fee. I set bandwidth out (a cost item for AWS) at 100GB/month. I think the above modeling is a reasonable representation of what an enterprise would be likely to pay for this capacity over the given period of time, and so is fair for this test. The same is true on the vCHS side.
WINNER: vCHS on performance (by a wide margin) AWS on cost (by a wide margin)
Conclusions
At this stage the conclusion is a bit tricky. vCHS clearly wins by a wide margin on performance. That said, the offerings aren’t really directly comparable from a commercial model standpoint at this stage, and EC2 did come in significantly cheaper. If the cheapest performance is what you’re after, EC2 would have been the winner here (not to mention that all of this Windows work would be free for a year). Of course in the real world cost is not the sole metric. vCHS provided such a significant performance benefit that the cost might just wash, even at scale. In addition, the vCHS offering includes a much higher level of support. Adding business support on the AWS side would have increased the cost to $0.030 and left vCHS a winner across the board. This is a critically important dimension to keep in mind if you are evaluating enterprise adoption.
As promised this series will continue with more tests, more platforms and more metrics. Suggestions are most welcome!
